Indicators of Development (Grade 11 NSC Matric Geography): Revision Notes
Indicators of Development
Development indicators are standardised tools that help us measure and compare how developed different countries are. These special units measure specific aspects of development, allowing geographers and economists to understand patterns of development around the world.
What are development indicators?
Development indicators are like measuring tools that help us understand different levels of development between countries. Just as we might use different tools to measure height, weight, or temperature, we use different indicators to measure various aspects of how developed a country is.
Think of development indicators as a common language that allows us to discuss and compare development globally. Just like scientists use standardised units (metres, kilograms, degrees Celsius), development experts use standardised indicators to make fair comparisons between nations.
These indicators are designed and formulated by international organisations to ensure they can be used to make fair comparisons between different nations.
1. Economic indicators of development
Economic indicators focus on measuring the wealth and economic activity within a country. For many years, people believed that if a country was wealthy, it would automatically provide a high standard of living for its citizens.
Gross domestic product (GDP) and gross national product (GNP)
Gross Domestic Product (GDP) measures the total value of all goods and services produced within a country's borders in one year. This includes everything from cars manufactured in factories to haircuts provided in salons.
Gross National Product (GNP) takes GDP and adds the income earned by the country's citizens and companies working abroad. For example, if a South African company operates mines in other African countries, that income would be included in South Africa's GNP.
GDP per capita - a key measure
GDP per capita is calculated by dividing a country's total GDP by its population. This gives us an average figure showing how much each person in the country theoretically "earns" from the national economic activity.
Formula:
Worked Example: Calculating GDP per capita for South Africa (2010)
Given information:
- GDP = R2,661,433,000
- Population = 49,991,300
Step 1: Apply the formula
Step 2: Substitute the values
Step 3: Calculate the result GDP per capita = R55,238
Important note: This is an average figure - some South Africans earned much more than R55,238 in 2010, while many others earned significantly less.
Global income patterns
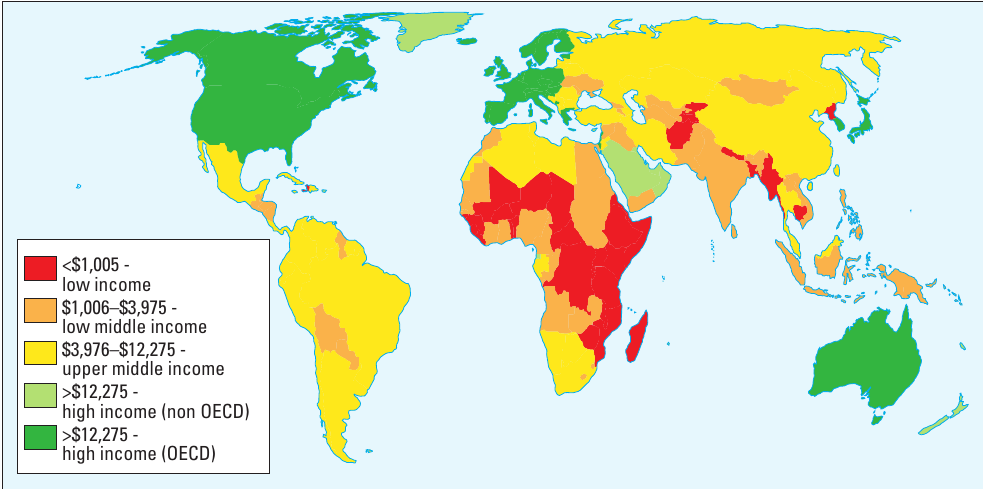
Countries are classified into different income categories by the World Bank:
- Low income countries (under $1,005) - shown in red
- Lower middle income countries (3,975) - shown in orange
- Upper middle income countries (12,275) - shown in yellow
- High income non-OECD countries (over $12,275) - shown in light green
- High income OECD countries (over $12,275) - shown in dark green
This classification reveals clear global patterns, with most Sub-Saharan African countries falling into the low-income category, while North America, Western Europe, and Australia represent high-income regions.
2. Social indicators of development
While GDP tells us about a country's wealth, it doesn't reveal much about the actual living conditions or quality of life for ordinary people. Social indicators help fill this gap by measuring the welfare and capabilities of a population.
Human development index (HDI)
The Human Development Index (HDI) is a composite indicator that combines three important aspects of human development:
- Literacy levels (education)
- Life expectancy (health)
- GDP per capita (living standards)
Understanding the HDI Scale
The HDI produces a value between 0 and 1 for each country:
- Values closer to 1 indicate high human development
- Values closer to 0 reflect low human development
Remember: Think of HDI as combining the "3 L's" - Literacy, Life expectancy, and Living standards (income).
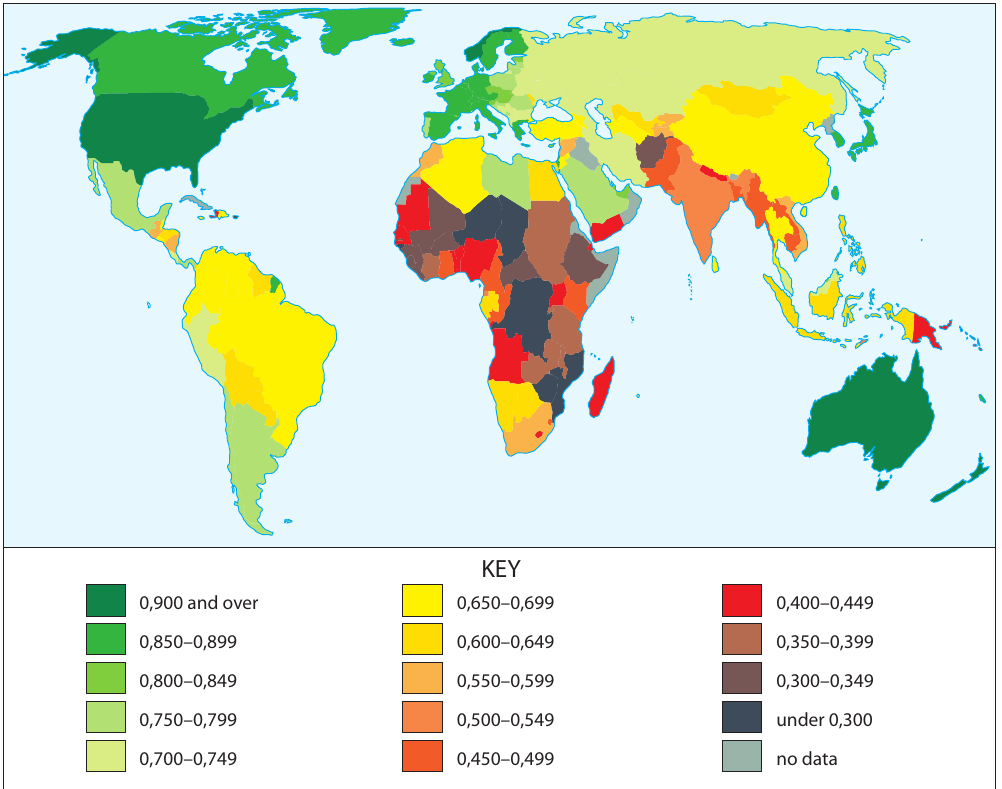
There is generally a strong relationship between income levels and HDI values - countries with higher incomes tend to have higher HDI scores. However, countries with similar income levels can have different HDI values, showing that wealth alone doesn't guarantee high quality of life.
Gini coefficient - measuring inequality
The Gini coefficient measures how wealth is distributed within a society. It ranges from 0 to 1 (sometimes presented as 0 to 100):
- 0 (or 0%) = Perfect equality (everyone earns exactly the same)
- 1 (or 100%) = Perfect inequality (one person has all the wealth)
The higher the Gini coefficient, the greater the inequality between rich and poor within that country.
South African Inequality Example
South Africa has a very high Gini coefficient, meaning there's significant inequality within the country.
2010 Income Distribution:
- Richest 10% of population: earned 53% of all income
- Poorest 10% of population: earned only 0.6% of total income
This demonstrates how wealth can be very unevenly distributed even within a single country.
3. Demographic indicators of development
Demographic indicators provide information about population characteristics that are closely linked to development levels. Two key demographic indicators are particularly important for understanding development.
Life expectancy at birth
Life expectancy at birth indicates the average number of years a person born in a particular country can expect to live. This reflects the overall quality of healthcare, nutrition, education, and living conditions available in that society.
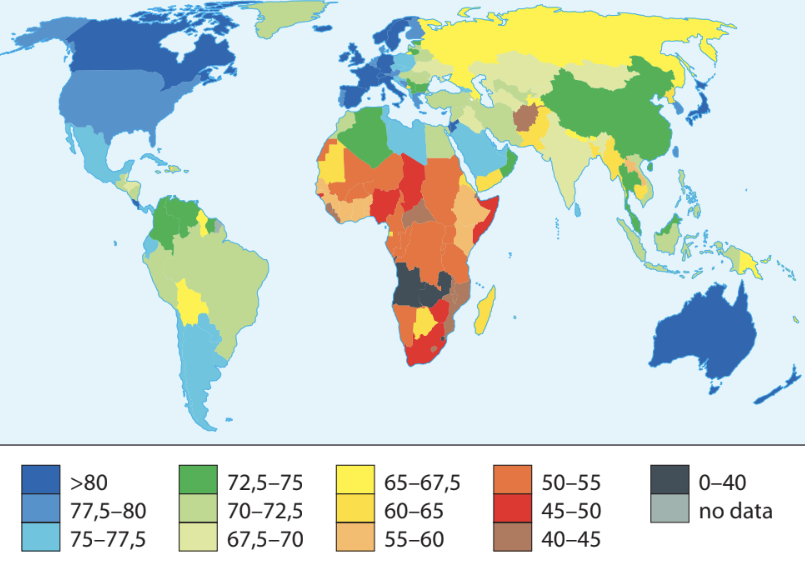
People live longer in societies where they have access to:
- Good nutrition
- Quality healthcare
- Extended education opportunities
- Safe employment opportunities
Examples of global variation:
- Japanese women: 85.72 years
- Angolan women: 38.57 years
Infant mortality rate
The infant mortality rate measures the number of deaths of babies under 1 year old per 1,000 live births in a given year. This is a powerful indicator of development because infant survival depends on many factors including healthcare quality, nutrition, clean water access, and education levels.
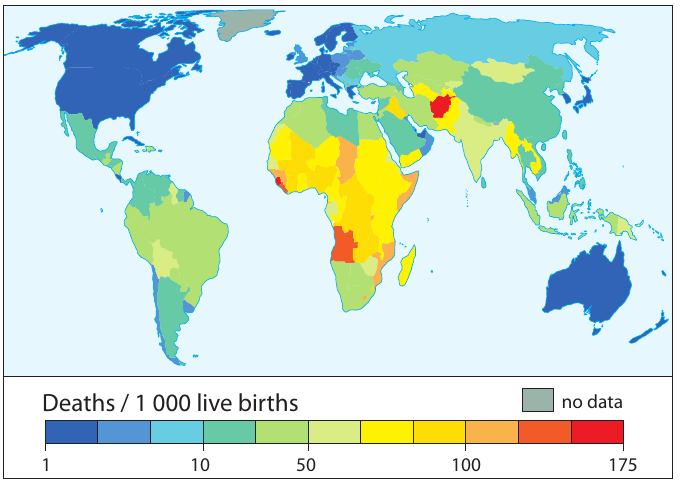
The quality of healthcare, including access to well-equipped hospitals and vaccination programmes, directly affects infant mortality rates:
- Canada: 4.92 deaths per 1,000 live births
- Afghanistan: 149.2 deaths per 1,000 live births
The relationship between indicators
Key Relationships Between Development Indicators
Generally, there are clear patterns in how demographic indicators relate to economic development:
- Where life expectancy is high → infant mortality tends to be low
- Countries with higher income and HDI values → typically have better demographic outcomes
- High life expectancy → usually correlates with higher levels of income and human development
These relationships help explain why multiple indicators are needed to understand the full picture of development.
Comparing development indicators
| Country | Infant Mortality | Life Expectancy | Income ($US) | HDI | Gini |
|---|---|---|---|---|---|
| Afghanistan | High | Low | Low | Low | - |
| Australia | Low | High | High | High | Moderate |
| Sweden | Low | High | High | High | Low |
| South Africa | Moderate | Moderate | Middle | Moderate | Very High |
| Argentina | Moderate | High | Middle | High | High |
| Canada | Low | High | High | High | Moderate |
| Chad | Very High | Low | Low | Low | High |
This comparison shows that development is complex - countries can perform differently across various indicators, highlighting the importance of using multiple measures rather than relying on just one indicator.
Critical Insights About Development Measurement
- Economic development doesn't automatically guarantee high quality of life
- Multiple indicators provide a more complete picture than single measures
- Global inequalities are clearly visible across all types of indicators
- Relationships exist between different indicators, but exceptions occur
- Context matters - countries with similar incomes can have very different development outcomes
Key Points to Remember:
-
Development indicators are standardised tools that allow us to compare development levels between different countries fairly and accurately
-
Economic indicators like GDP per capita measure wealth, but don't tell the full story about quality of life for ordinary people
-
Social indicators such as HDI and the Gini coefficient reveal important information about human welfare and inequality that economic measures might miss
-
Demographic indicators like life expectancy and infant mortality rates reflect the overall health and living conditions within a society
-
Using multiple indicators together provides a much more complete and accurate picture of development than relying on any single measure alone