Africa's Weather and Climate (Grade 11 NSC Matric Geography): Revision Notes
Reading and Interpreting Synoptic Weather Maps
What are synoptic weather maps?
Synoptic weather maps provide us with a comprehensive summary of weather conditions across South Africa at a specific time each day (14:00). These maps are essential tools that meteorologists use to understand current weather patterns and make forecasts. The word "synoptic" means "giving a general view of the whole," which perfectly describes how these maps show us the big picture of weather across large areas.
Think of synoptic weather maps as weather snapshots that capture atmospheric conditions at weather stations across the country. They help us see patterns, predict changes, and understand how different weather systems interact with each other.
Understanding the timing: All synoptic weather maps in South Africa show conditions at exactly 14:00 (2:00 PM) each day. This standardized timing allows meteorologists to compare weather patterns consistently and track how systems develop over time.
Station models
Station models are standardized symbols used on synoptic weather maps to display weather information from specific locations where daily readings are taken. These models pack a lot of information into a small space using a clever arrangement of symbols and numbers.
The beauty of station models lies in their organized layout. Each piece of weather information has a specific position around the station circle, making it easy to read once you know the system. For example, air temperature appears in one position, while dew point temperature appears in another. Wind direction is shown by the direction of lines extending from the station, while wind speed is indicated by the length and style of these lines.
Weather conditions are represented by various symbols. Rain appears as filled circles, while drizzle uses comma-like symbols. Showers are shown with triangular symbols, and snow uses asterisk-like marks. Thunderstorms have their own special symbols, and when combined with hail, they use a different variation.
Cloud cover uses a particularly intuitive system - the station circle is filled in proportionally to show how much of the sky is covered. A completely clear sky shows as an empty circle, while overcast conditions fill the entire circle. Partial cloud cover shows as partially filled circles, with specific fractions (1/8, 2/8, etc.) clearly indicated.
Memorizing station models: The key to reading station models quickly is understanding that every piece of information has a fixed position. Once you learn these positions, you can read any station model instantly, regardless of which weather station it represents.
Understanding isobars
Isobars are one of the most important features on synoptic weather maps. These lines connect places that have equal atmospheric pressure, similar to how contour lines on topographic maps connect places of equal height. Pressure is measured in hectopascals (hPa), and you'll see these values labeled along the isobar lines.
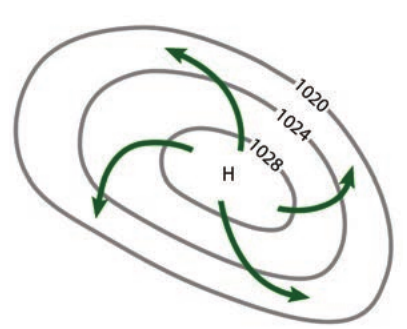
The pattern of isobars reveals fascinating information about weather systems. When isobars form closed circular or oval patterns, they indicate pressure cells. High-pressure cells (marked with "H") are called anticyclones, while low-pressure cells (marked with "L") are called cyclones.
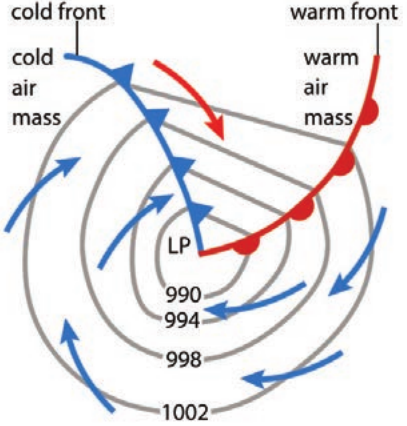
In the Southern Hemisphere, wind circulation around these pressure systems follows predictable patterns. Around high-pressure systems, air moves in an anticyclockwise direction, while around low-pressure systems, air moves clockwise. This is opposite to the Northern Hemisphere due to the Coriolis effect.
Worked Example: Reading Pressure Gradients
Step 1: Look at isobar spacing
- Closely packed isobars = steep pressure gradient
- Widely spaced isobars = gentle pressure gradient
Step 2: Predict wind strength
- Steep pressure gradient = strong winds
- Gentle pressure gradient = light winds
Step 3: Apply to real situations
- If isobars are 2 hPa apart over 100km = strong winds expected
- If isobars are 8 hPa apart over 200km = light winds expected
The spacing between isobars tells us about wind speed. When isobars are closely packed together, the pressure gradient is steep, resulting in strong winds. When isobars are widely spaced, the pressure gradient is gentle, producing light winds. This relationship between pressure gradient and wind speed is crucial for understanding and predicting weather conditions.
Buys Ballot Law: This law states that if you stand with your back to the wind in the Southern Hemisphere, high pressure will always be on your left-hand side. This simple rule helps meteorologists and weather enthusiasts quickly identify pressure systems and predict wind patterns.
High-pressure systems are generally associated with pleasant weather conditions. They bring divergence and subsidence of air, leading to clear skies, calm conditions, and stable weather. Low-pressure systems, on the other hand, are associated with convergence and rising air, which creates cooling, condensation, and increased chances of precipitation and unsettled weather.
Weather fronts
Weather fronts represent the boundaries between different air masses and are crucial features on synoptic weather maps. Understanding fronts helps us predict significant weather changes and their associated conditions.
Cold fronts appear as thick lines with triangular symbols pointing in the direction of movement. These fronts occur when a cold air mass pushes into a warmer air mass. The triangular symbols are colored blue on colored maps, and the cold air is always found on the side of the front where the triangles point.
Warm fronts are shown as thick lines with semicircular symbols, typically colored red on colored maps. These form when a warm air mass gradually overtakes a cooler air mass. The semicircular symbols point in the direction the front is moving, and the warm air is located on the side with the semicircles.
The weather associated with these fronts differs significantly. Cold fronts typically bring dramatic weather changes, including sudden temperature drops, strong winds, and often thunderstorms or heavy showers. The weather changes are usually intense but brief. Warm fronts, in contrast, bring more gradual changes with steady light rain or drizzle over larger areas for longer periods.
Seasonal patterns in South Africa: These fronts are commonly associated with mid-latitude cyclones that move from west to east across South Africa. During summer, these systems typically pass to the south of the country, while in winter, they move far enough north to bring cold weather and rain to the Western Cape region.
Reading actual synoptic weather maps
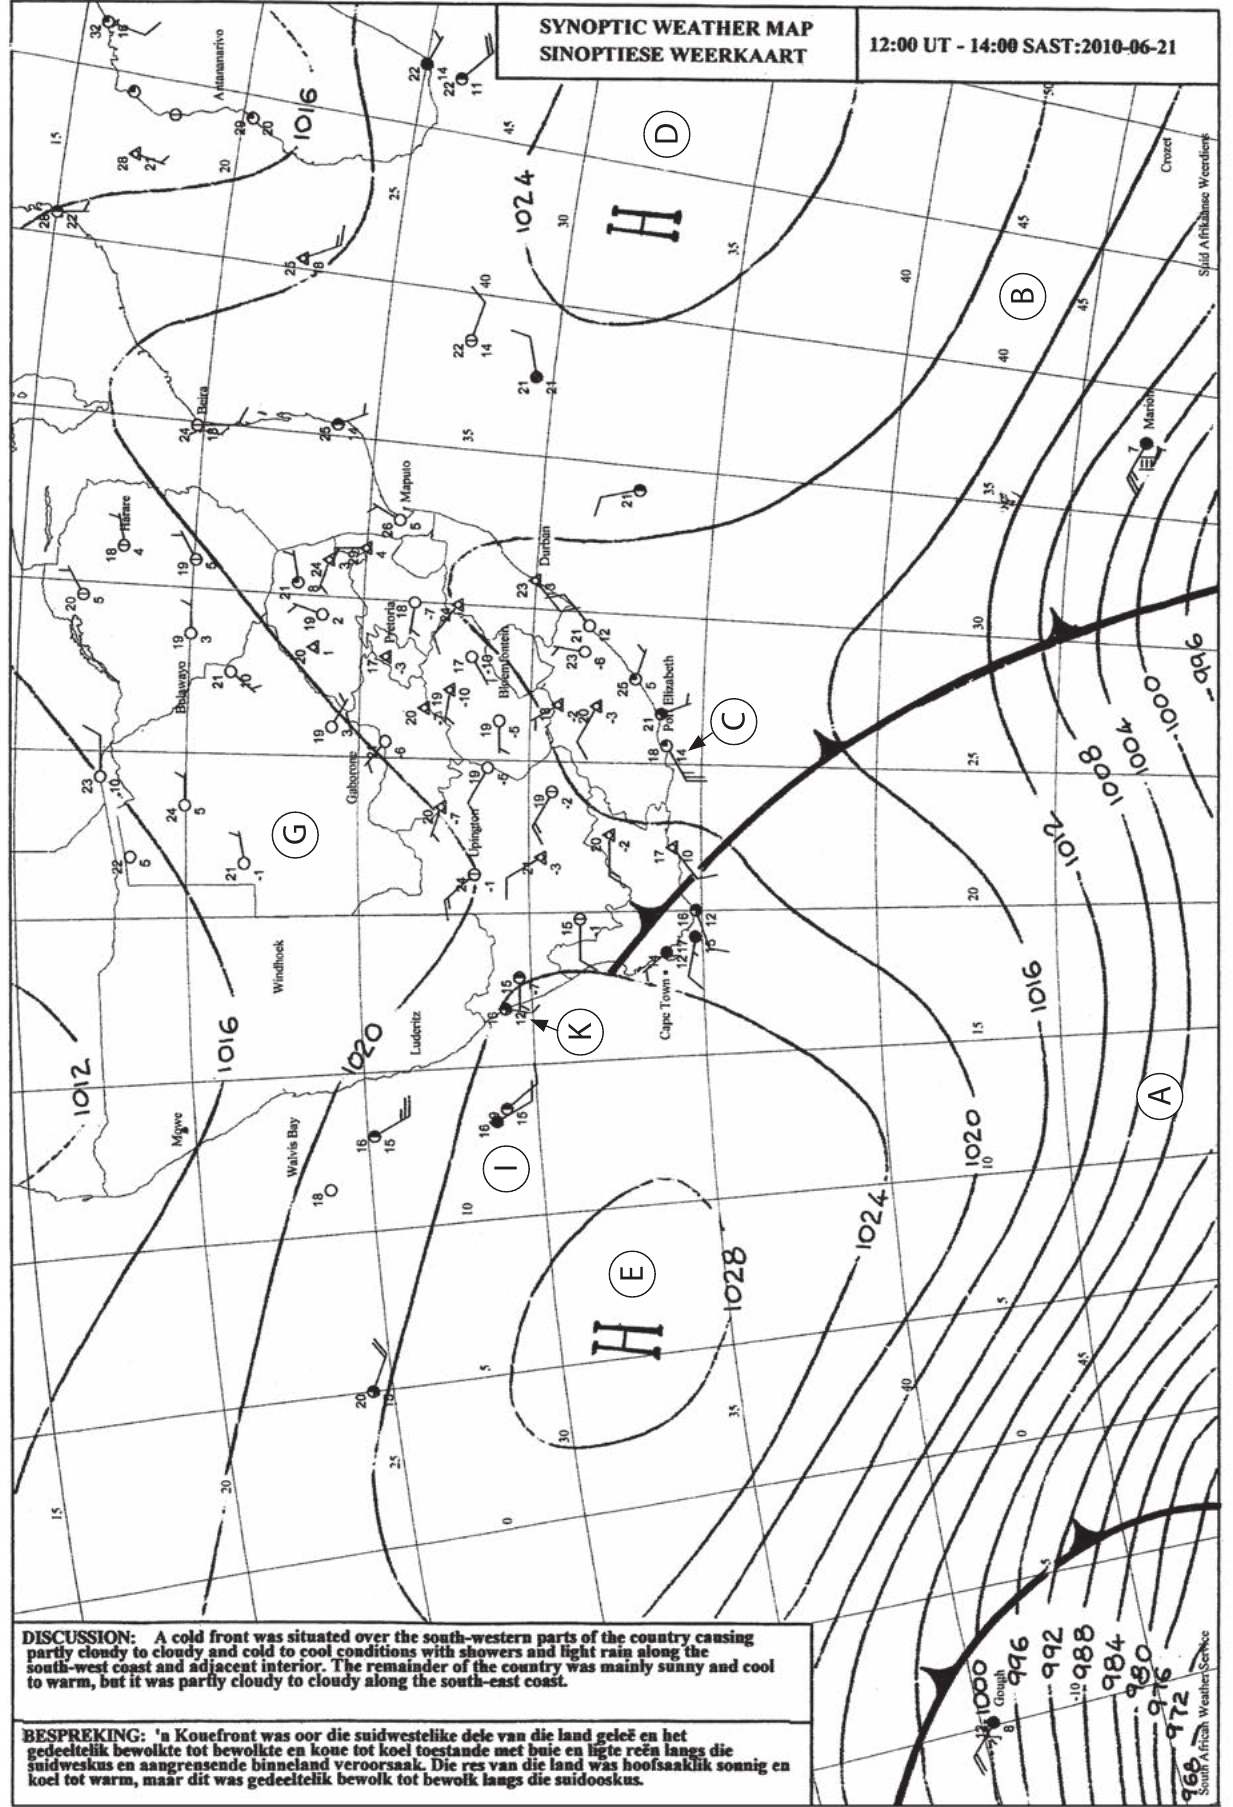
Real synoptic weather maps combine all these elements - station models, isobars, and fronts - to provide a complete picture of atmospheric conditions. When interpreting these maps, start by identifying the major pressure systems and their centers.
Look for areas where isobars are closely spaced, as these indicate regions of strong winds. Identify any frontal systems and consider what weather they might bring to different areas. Pay attention to the movement patterns of these systems to help predict future weather conditions.
The station models scattered across the map provide ground truth - actual observations that confirm or refine what the broader patterns suggest. By comparing station observations with the larger-scale patterns, meteorologists can fine-tune their forecasts and identify any unusual local conditions.
When recording information from station models, it's helpful to organize the data systematically. Temperature, dew point temperature, wind speed, wind direction, and cloud cover are the key elements that paint a picture of local conditions. This information becomes particularly valuable when combined with the broader synoptic patterns.
Key Points to Remember:
-
Synoptic weather maps provide daily snapshots of weather conditions across South Africa at 14:00, helping us understand large-scale atmospheric patterns
-
Station models use standardized symbols and positioning to display multiple weather elements efficiently, with each type of information having a specific location around the station circle
-
Isobars connect points of equal pressure and reveal pressure systems - closely spaced isobars indicate strong winds, while widely spaced isobars suggest calm conditions
-
In the Southern Hemisphere, air circulates anticyclockwise around high-pressure systems (bringing good weather) and clockwise around low-pressure systems (bringing unsettled weather)
-
Weather fronts mark boundaries between air masses, with cold fronts bringing sudden, intense weather changes and warm fronts causing gradual, widespread changes
-
Remember Buys Ballot Law: stand with your back to the wind, and high pressure is on your left!