Human Population (Grade 11 NSC Matric Life Sciences): Revision Notes
Human Population
Historical growth and current status
Humans evolved as a species around 200,000 years ago, when the global population was probably less than several hundred people. Today, our population has grown dramatically to reach over 8 billion people worldwide. This represents one of the most remarkable population explosions in the history of any species on Earth.
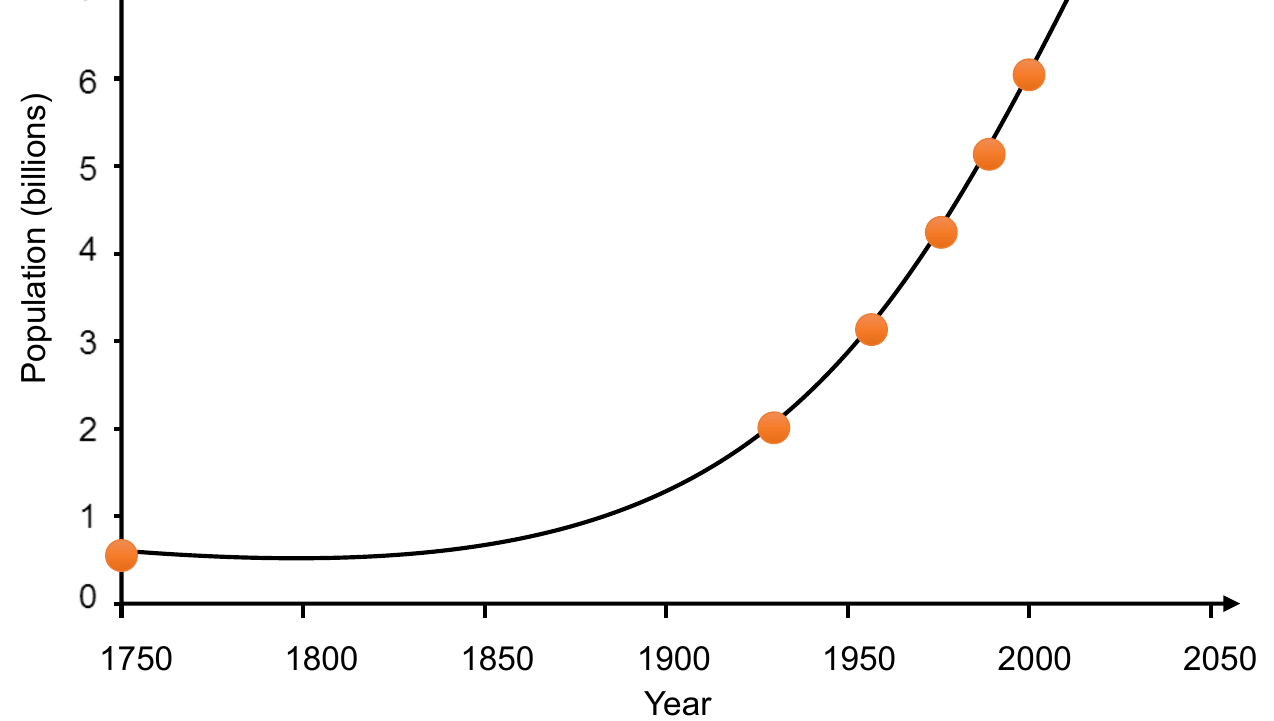
The graph above shows how human population growth has followed an exponential pattern, particularly over the last 200 years. This means that population size has increased at an accelerating rate rather than growing steadily - like a snowball rolling downhill that gets bigger and faster as it goes!
Reasons for exponential growth
Human population growth has exploded due to three main factors that have increased our carrying capacity (the maximum number of individuals an environment can support) while reducing environmental resistance (factors that limit population growth).
Key Concept: By continuously increasing our carrying capacity whilst reducing environmental resistance, humans have broken through the normal population limits that affect other species.
Agricultural improvements
Through better farming techniques, humans have been able to dramatically increase and secure food availability. This includes developing new crop varieties, improved irrigation systems, fertilisers, and farming machinery. When food becomes more abundant and reliable, populations can grow larger because fewer individuals die from starvation.
Medical improvements
Medical technology has advanced incredibly over just a few hundred years. We can now prevent, treat, and cure many diseases that once killed large numbers of people. Vaccines protect against deadly diseases, antibiotics fight infections, and surgical techniques save lives. We can also control the spread of pathogenic diseases (disease-causing organisms) through better understanding of hygiene and disease transmission.
Technological improvements
Technology has made daily life easier and more convenient, supporting larger populations. This includes clean water systems, improved transportation, better housing, communication systems, and industrial processes that produce goods more efficiently. These advances have further increased our carrying capacity.
Memory Aid: Remember AMT - Agricultural, Medical, and Technological improvements are the three main drivers of human population growth.
Age-gender population pyramids
Scientists collect information about populations by conducting a census - a count of all individuals in a region. This data is then organised by age groups and gender, and presented visually as a population pyramid.
Age-gender pyramids are demographic graphs that show the age and gender structure of a population. Each horizontal bar represents a different age group, with males typically shown on the left and females on the right.
There are three main types of population pyramids, each revealing different growth patterns:
Expanding population pyramid
This pyramid shape indicates a rapidly growing population and is characteristic of developing countries.
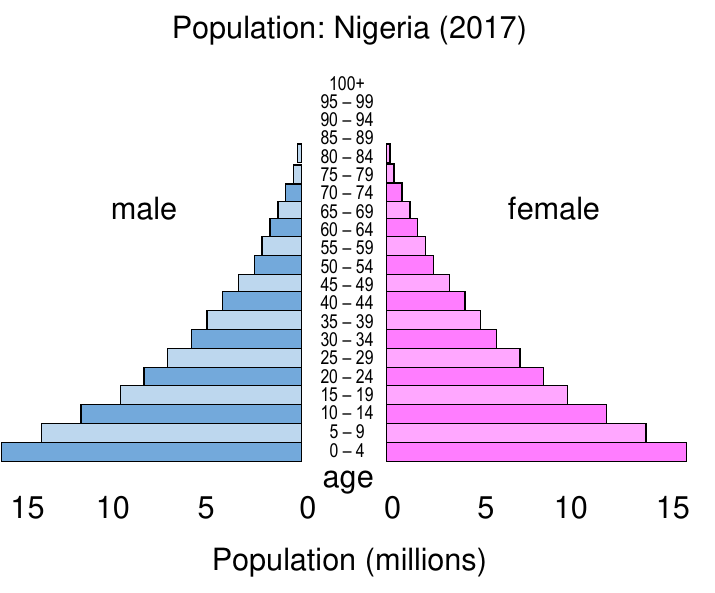
Key features include:
- More young people than elderly people (wide base, narrow top)
- Both natality rates (birth rates) and mortality rates (death rates) are high
- Few individuals reach old age due to limited medical care and social welfare
- Life expectancy, education levels, and general standard of living are all relatively low
Countries with Expanding Pyramids: Common in developing countries, third world countries, and many African nations like Nigeria (shown above).
Stable population pyramid
This pyramid shows a population with slow, steady growth typical of some developed countries.
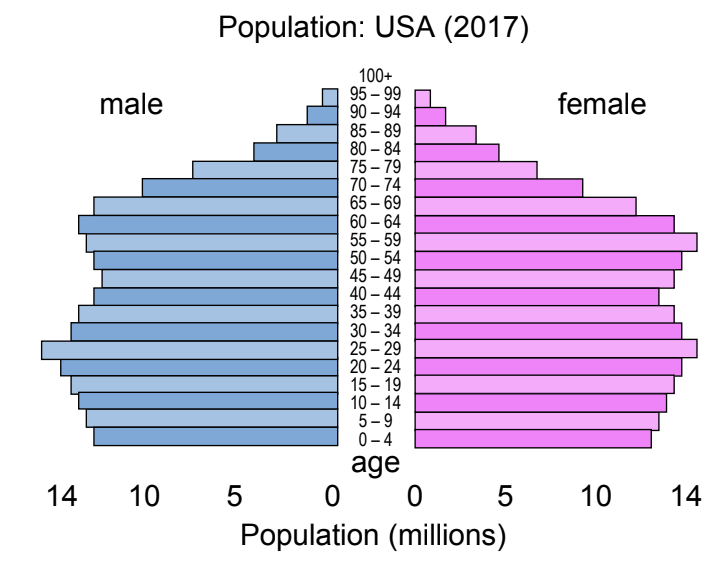
Key features include:
- Number of pre-reproductive individuals (young people) approximately equals the number of reproductive individuals (adults)
- Natality rates are low
- Many individuals reach older ages because of good medical and social welfare services
- Life expectancy, education levels, and standard of living are all relatively high
Countries with Stable Pyramids: Characteristic of certain developed countries such as the USA (shown above) and China.
Declining population pyramid
This pyramid indicates a shrinking population, typical of highly developed countries.
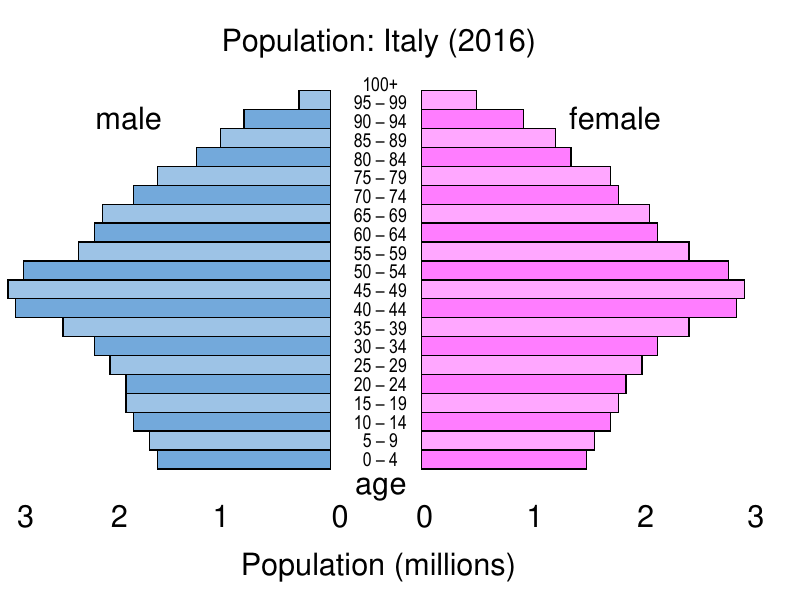
Key features include:
- Pre-reproductive groups are smaller than reproductive groups (narrow base, wider middle)
- Both natality and mortality rates are low
- Many individuals reach older ages due to excellent medical care and strong social welfare systems
- Life expectancy, education levels, and standard of living are relatively high
Countries with Declining Pyramids: Characteristic of developed countries such as the UK, Japan, Denmark, and Italy (shown above).
Population regulation factors
Besides the growth factors mentioned above, human populations are also affected by:
- Global environmental conditions - such as climate change and natural disasters
- Wars and conflicts - which increase mortality rates
- Famines and food shortages - which limit carrying capacity
- Economic recessions - which affect living standards and birth rates
- Disease outbreaks - including incurable diseases that spread through international travel
Government Impact: Government policies can also regulate population sizes through legislation. Some countries implement direct population control measures, whilst others use policies that indirectly influence family size decisions.
The South African population
Growth trends and projections
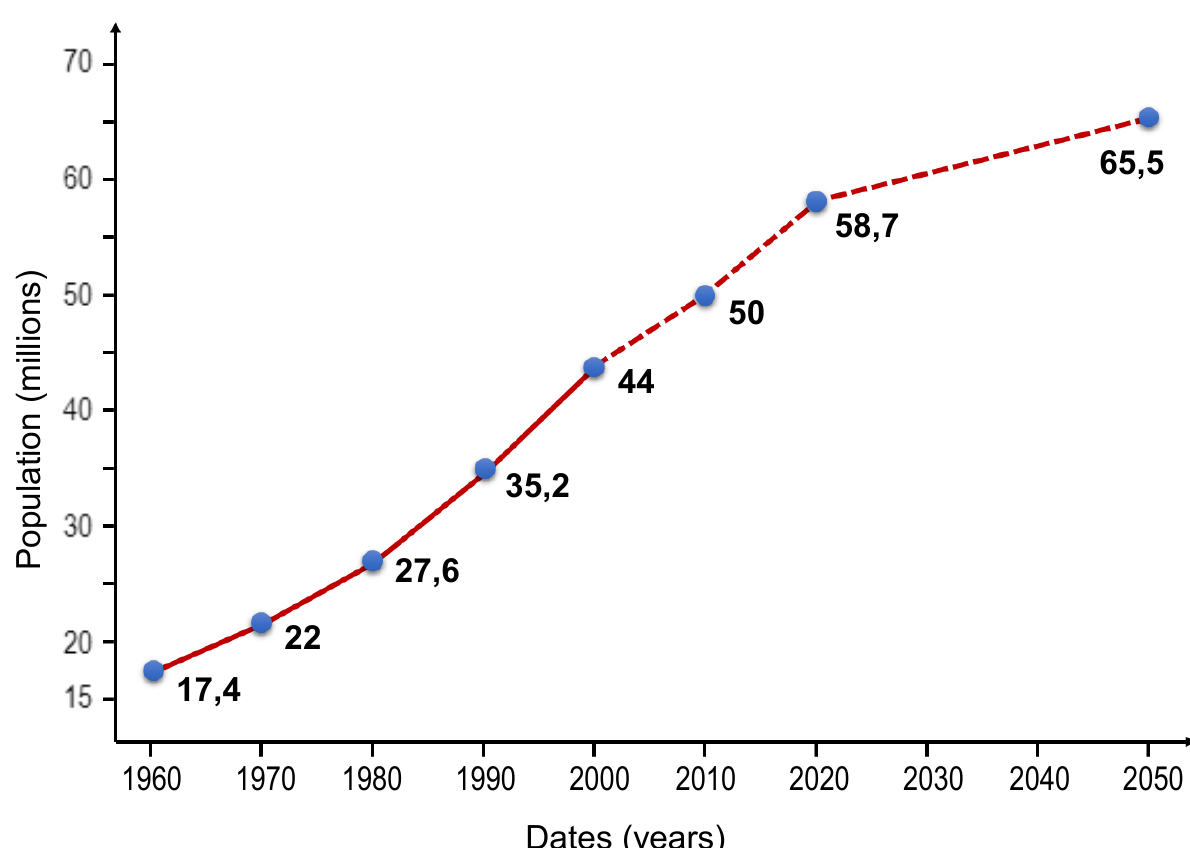
South Africa's population, like the global population, has shown steady increases and is projected to continue growing in the future.
South African Population Growth Data
| Year | Population (millions) |
|---|---|
| 1960 | 17.4 |
| 1970 | 22.0 |
| 1980 | 27.6 |
| 1990 | 35.2 |
| 2000 | 44.0 |
| 2010 | 50.0 |
| 2020 | 58.7 |
| 2050 | 65.5 (projected) |
Projections beyond 2018
The South African population grew steadily over 58 years (1960-2018) by approximately 40 million people. However, this growth rate is expected to slow down significantly over the next 30 years, adding only about 8 million more people.
This slowdown is largely due to declining birth rates. The fecundity rate (birth rate) has decreased dramatically:
- In 1955: the average South African female had 6.05 children during her lifetime
- By 2018: this had decreased to just 2.52 children per woman
Life expectancy trends
Life expectancy has improved significantly in South Africa:
- 1960: 49 years
- 2016: 60 years
However, this is still considerably lower than the global average of 70.5 years. Reasons for longer life expectancy globally include:
- Better health and sanitation systems
- Social welfare improvements
- Increased access to primary healthcare services
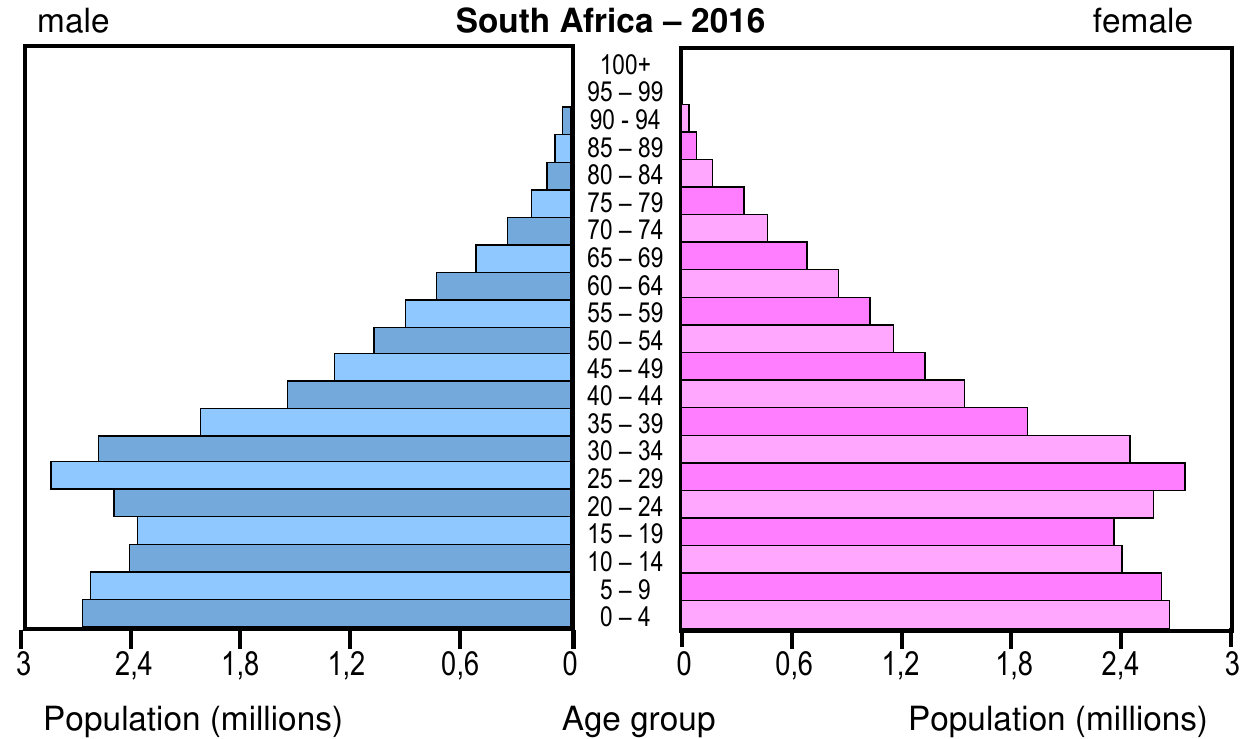
South Africa's 2016 population pyramid shows characteristics of a country in demographic transition, with a relatively young population but signs of slowing growth.
What this means for South Africa's future
Population data helps policymakers, government, and society plan for South Africa's future. Key considerations include:
- Population growth: Our population size continues to increase
- Ageing population: People are living longer
- Economic complexity: The business world is becoming more sophisticated
This requires proper planning for:
- Urban development: City planning for growing populations
- Infrastructure: Schools, hospitals, and other essential services
- Economic zones: Industrial development areas to provide employment
Exam Tip: When analysing population pyramids, always look at the shape of the base (birth rates), the middle section (working-age population), and the top (elderly population) to determine the type of pyramid and what it reveals about the country's development level.
Key Points to Remember:
- Human population has grown exponentially from less than several hundred people 200,000 years ago to 7.66 billion today
- Three main factors drove this growth: Agricultural improvements (better food security), Medical advances (disease control), and Technological progress (improved living conditions)
- Population pyramids reveal demographic patterns: expanding pyramids show growing populations (developing countries), stable pyramids indicate slow growth (some developed countries), and declining pyramids show shrinking populations (highly developed countries)
- South Africa's population grew from 17.4 million (1960) to over 58 million today, but growth is slowing due to declining birth rates
- Life expectancy in South Africa improved from 49 years (1960) to 60 years (2016), though still below the global average of 70.5 years