Population Size (Grade 11 NSC Matric Life Sciences): Revision Notes
Population Size
Introduction to population ecology
Population ecology is the scientific study of how groups of organisms interact with their environment and how their numbers change over time. Understanding population size is crucial for conservation efforts, wildlife management, and predicting how species respond to environmental changes.
A population consists of all the individuals of the same species that live in the same area at the same time and can breed with each other. This is different from a community (different species living together) or an ecosystem (all living and non-living components in an area).
Understanding the distinction between these ecological levels is essential:
- Population: Same species, same area, can interbreed
- Community: Multiple species interacting in one habitat
- Ecosystem: All living and non-living components together
Key terminology
Before exploring population size, it's important to understand these fundamental terms:
| Term | Definition |
|---|---|
| Species | A group of organisms that can interbreed and produce fertile offspring |
| Population | Individuals of the same species living in the same habitat who can interbreed |
| Community | Different species populations that interact within a specific habitat |
| Ecosystem | A community of organisms plus their physical environment |
| Habitat | The specific place where an organism lives and completes its life cycle |
| Natality | The birth rate in a population, usually expressed as a percentage |
| Mortality | The death rate in a population, usually expressed as a percentage |
| Immigration | New individuals moving into a population from other areas |
| Emigration | Individuals leaving a population to move to other areas |
Factors that influence population size
Population size constantly changes due to four main demographic processes. These work like a balance scale - some factors increase population size while others decrease it.
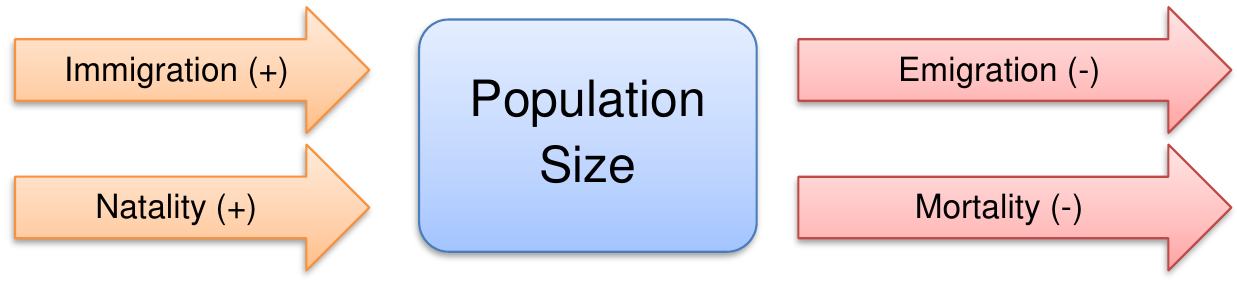
The equation for calculating population change is:
When this calculation gives a positive result, the population grows. When negative, the population shrinks.
Increasing population factors
Natality (birth rate): When environmental conditions are favourable, more offspring are born and survive to reproductive age. This increases population size.
Immigration: New individuals joining the population bring fresh genetic material and increase total numbers. Some may stay temporarily (like seasonal migrants), while others become permanent residents.
Decreasing population factors
Mortality (death rate): Deaths from disease, predation, accidents, or old age reduce population size. High mortality rates can quickly shrink populations.
Emigration: When individuals leave to find better resources or mates elsewhere, the original population decreases. This often happens when overcrowding occurs.
Remember these four factors with the mnemonic "NIME":
- Natality (births)
- Immigration (moving in)
- Mortality (deaths)
- Emigration (moving out)
Environmental resistance and carrying capacity
Not all populations can grow indefinitely. Environmental resistance includes all the factors that prevent unlimited population growth.
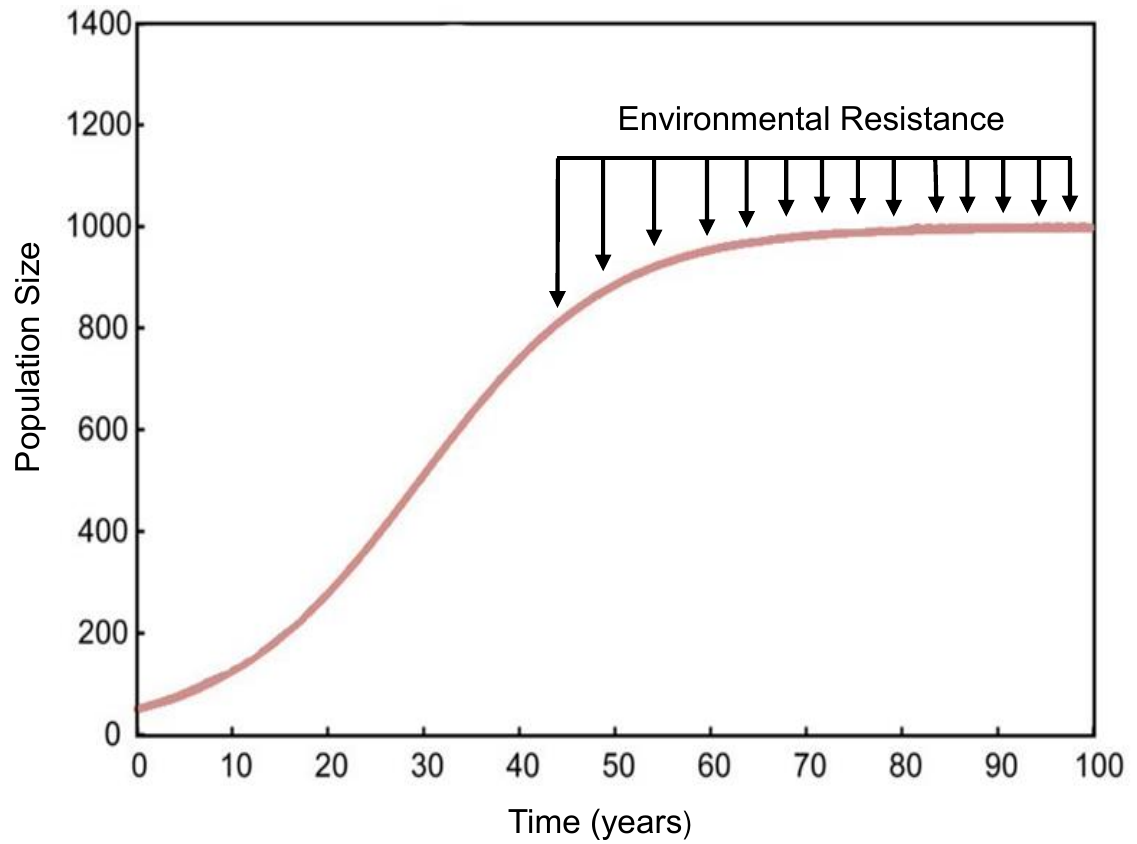
Carrying capacity represents the maximum number of individuals that an environment can support sustainably over time. When populations approach this limit, growth slows dramatically.
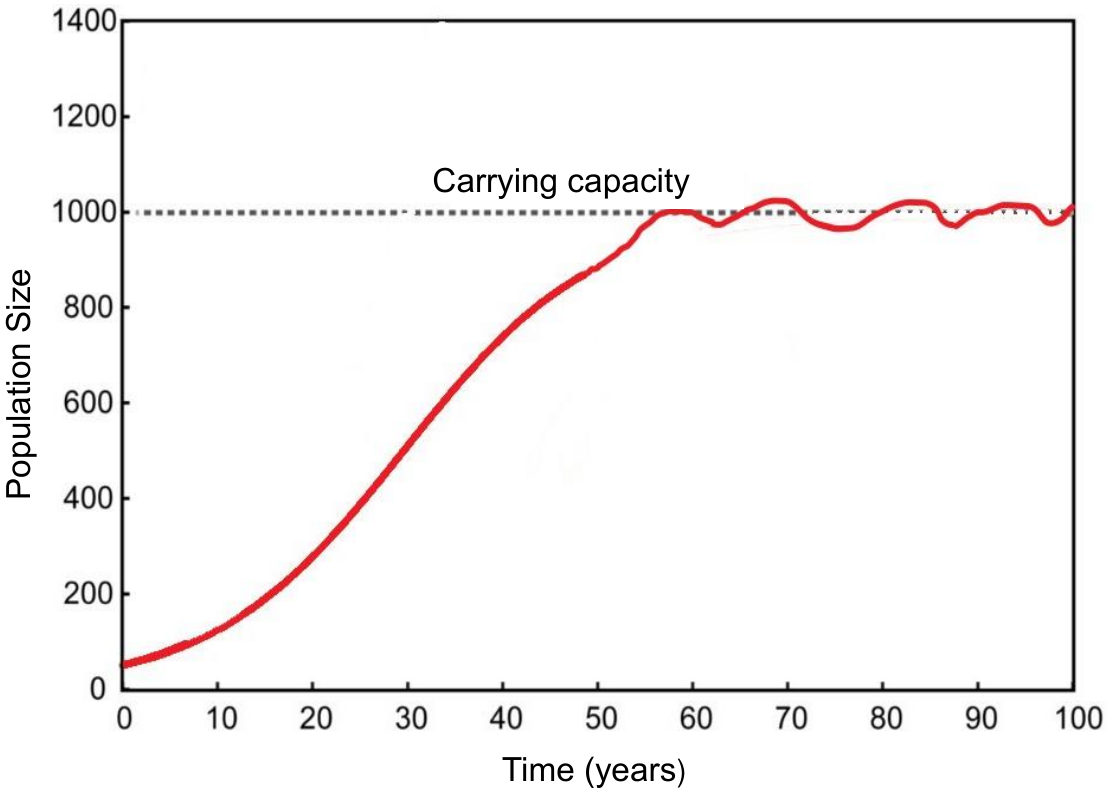
In a stable population, numbers fluctuate around the carrying capacity but don't exceed it for long periods. However, if a population overshoots its carrying capacity, resources become depleted and the population may crash dramatically.
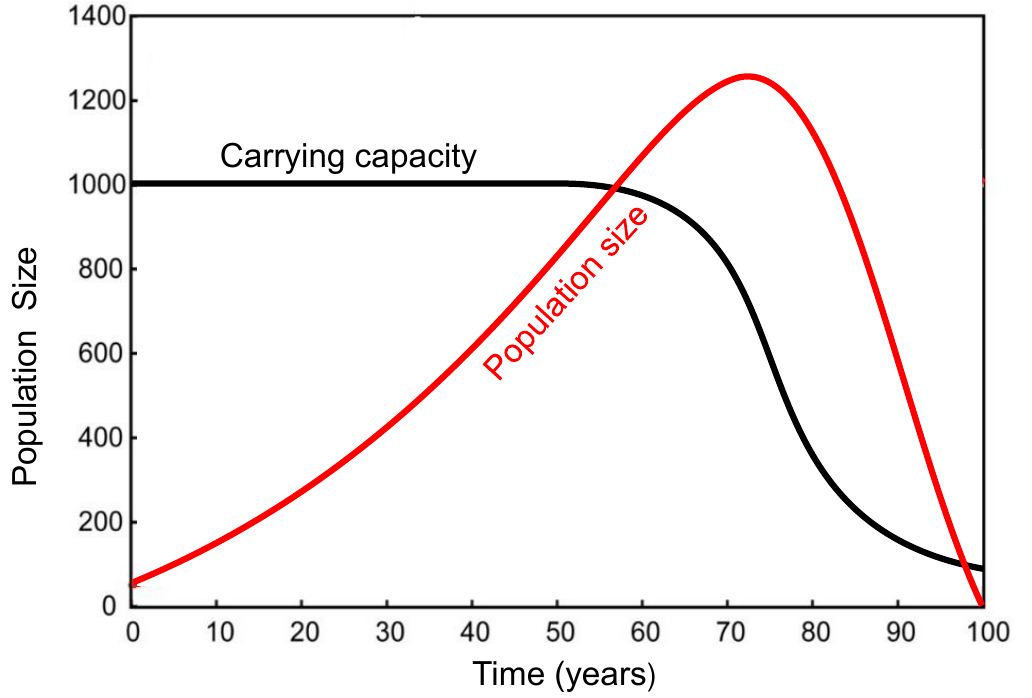
When populations exceed their carrying capacity, they often experience a dramatic population crash. This happens because:
- Resources become depleted faster than they can be replenished
- Competition intensifies beyond sustainable levels
- Environmental damage may reduce the habitat's future carrying capacity
Types of environmental resistance factors
Environmental resistance comes from two main types of factors:
Density dependent factors have stronger effects when populations are large and crowded. Examples include:
- Competition for food, water, space, and shelter
- Increased predation (more prey attracts more predators)
- Disease spread (easier in crowded conditions)
- Territorial behaviour and stress
- Accumulation of waste products
Density independent factors affect populations regardless of their size. These are usually unpredictable natural events such as:
- Natural disasters (tsunamis, volcanic eruptions, floods)
- Extreme weather events (droughts, severe storms)
- Wildfires and landslides
- Human activities (pollution, habitat destruction)
Methods for determining population size
Scientists use different techniques to measure population size depending on the type of organism and practical constraints.
Direct counting methods
Direct counting gives the actual population size and works best for larger, slow-moving organisms that are easy to observe.
Aerial photography: Taking photographs from aircraft or satellites allows researchers to count large animals like elephants, whales, or herds of grazing animals.

Census: A complete count of all individuals in a population. This method is commonly used for human populations but can also work for some wildlife populations in controlled areas.
Direct counting methods are most effective when:
- Animals are large enough to see clearly
- They move slowly or remain in open areas
- The study area is relatively small and accessible
- Weather and lighting conditions are suitable for observation
Indirect counting methods
When direct counting is impossible or impractical, scientists estimate population size using sampling techniques.
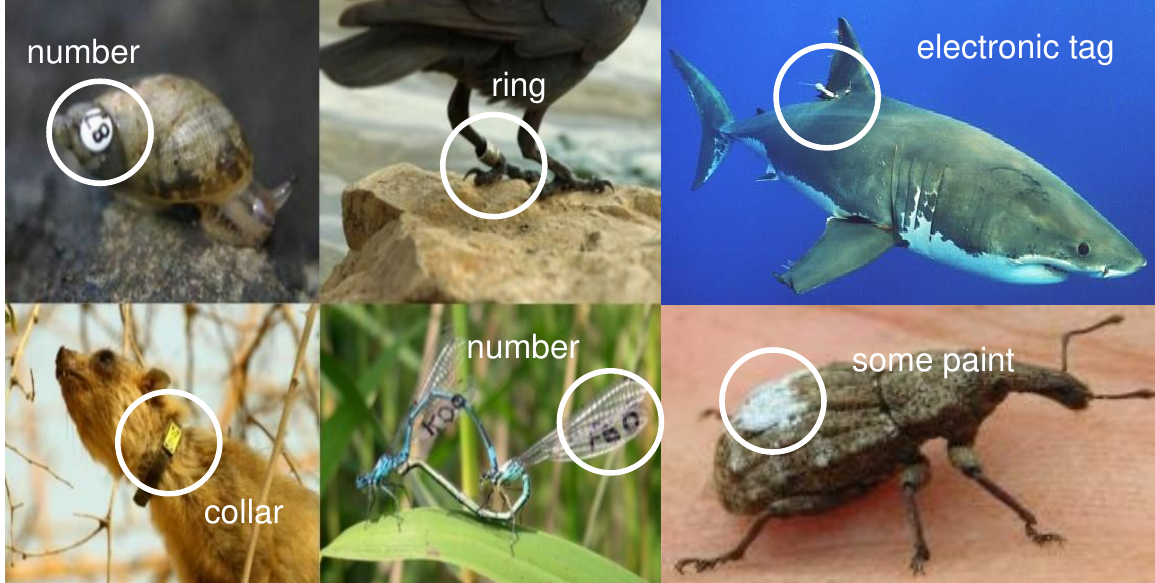
Mark-recapture method: This technique involves capturing a sample of animals, marking them harmlessly, releasing them, and later recapturing another sample to see how many marked individuals are found.
The calculation uses the Petersen Index formula:
Where:
- = estimated total population size
- = number of individuals marked in first sample
- = total number captured in second sample
- = number of marked individuals recaptured in second sample
Important precautions for mark-recapture include:
- Using marks that last the entire study period
- Ensuring marks don't harm animals or affect their behaviour
- Allowing enough time for marked animals to mix with the population
- Taking multiple samples to improve accuracy
Quadrat sampling: Square frames are placed randomly in an area to count organisms within them. This works well for plants, slow-moving animals, and sessile organisms like mussels.

Population size calculation:
For reliable results:
- Use multiple random samples
- Calculate averages from several quadrat throws
- Ensure quadrats are placed randomly across the study area
Worked example: mussel population study
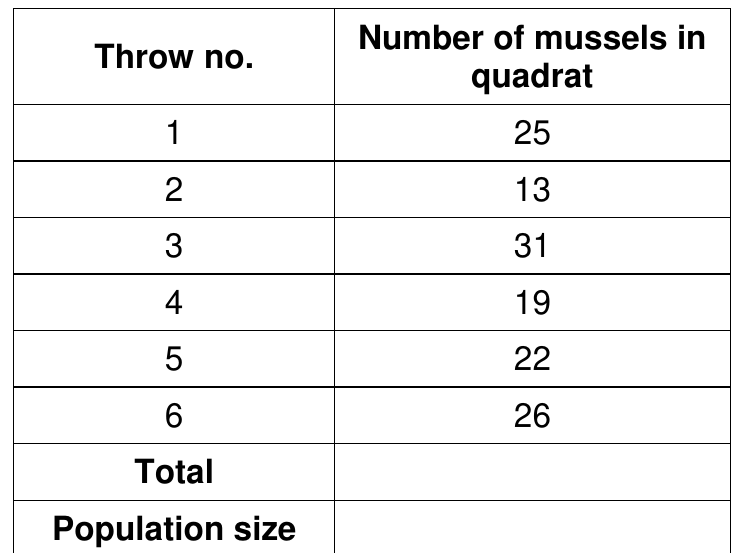
Worked Example: Calculating Mussel Population
Using the data shown, researchers can calculate the total mussel population in a rock pool by:
Step 1: Add all counts mussels
Step 2: Calculate average per quadrat mussels per quadrat
Step 3: Scale up to total area using the population formula
Population growth patterns
When population size is plotted against time, two main growth patterns emerge in nature.
Geometric (J-shaped) growth
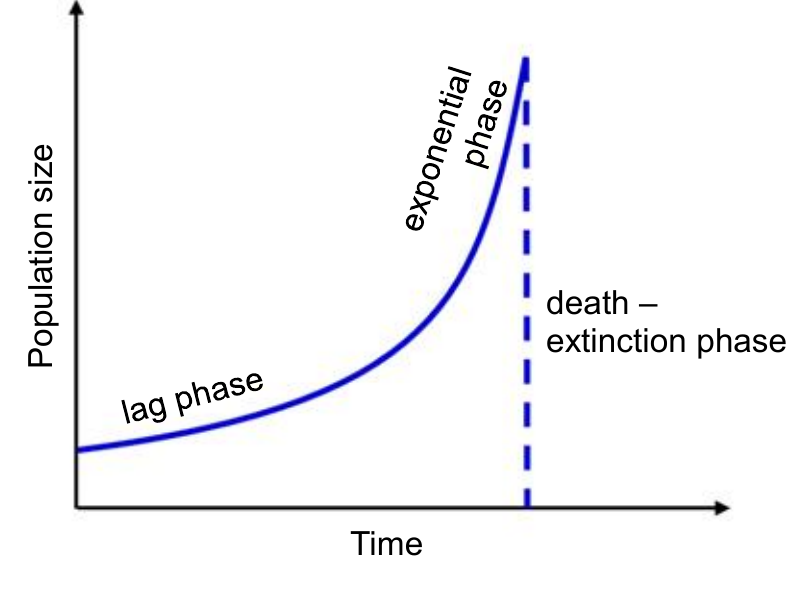
Geometric growth produces a J-shaped curve and occurs when populations can reproduce rapidly without significant environmental limits. This pattern is common in:
- Bacteria and other microorganisms
- Insects with short generation times
- Populations colonising new habitats
The pattern shows three phases:
- Lag phase: Slow initial growth as individuals establish themselves
- Exponential phase: Rapid population growth with abundant resources
- Death/extinction phase: Sudden collapse when resources are exhausted
Think of J-shaped growth as "Just exponential" - it grows rapidly without considering limits until resources run out, leading to a dramatic crash.
Logistic (S-shaped) growth
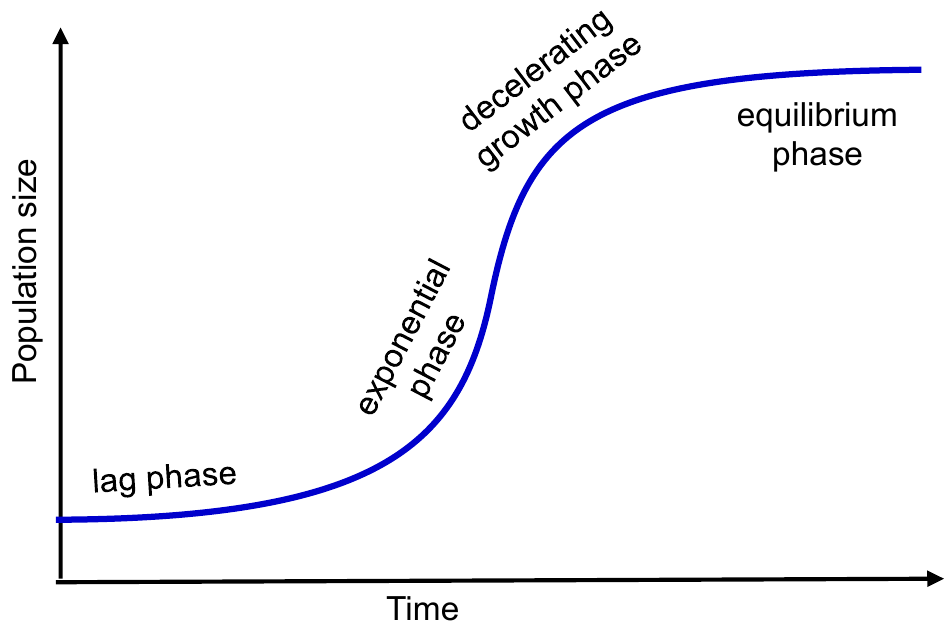
Logistic growth creates an S-shaped curve and is more common in larger organisms like mammals that reproduce more slowly. This sustainable growth pattern includes four main phases:
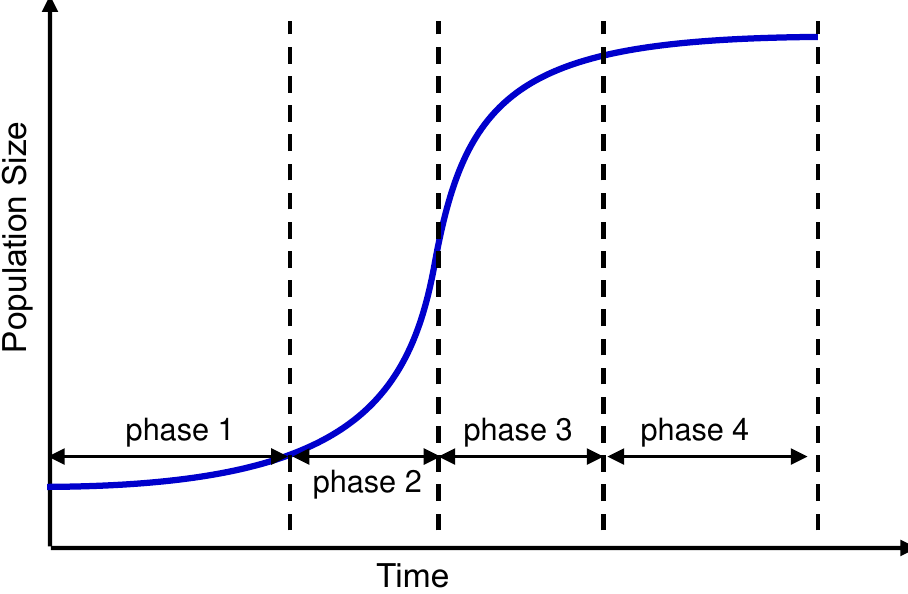
- Lag phase: Slow initial growth as the population establishes
- Exponential phase: Rapid growth when conditions are optimal
- Decelerating growth phase: Growth slows as environmental resistance increases
- Equilibrium phase: Population stabilises around carrying capacity
Logistic growth is more sustainable because it responds to environmental limits before resources are completely depleted.
Remember S-shaped growth as "Sustainable" growth - it naturally adjusts to environmental limits and reaches a stable equilibrium rather than crashing.
Comparison of growth patterns
| Feature | Geometric Growth | Logistic Growth |
|---|---|---|
| Shape | J-shaped curve | S-shaped curve |
| Common in | Microorganisms, insects | Larger animals, plants |
| Environmental limits | Ignored until collapse | Responded to gradually |
| Sustainability | Unsustainable | More sustainable |
| Outcome | Often ends in crash | Stabilises at carrying capacity |
Key Points to Remember:
-
Population size changes due to four factors: births, deaths, immigration, and emigration - remember "NIME"!
-
Environmental resistance prevents unlimited growth through density dependent factors (stronger when crowded) and density independent factors (affect all populations equally).
-
Carrying capacity is the maximum population size an environment can support sustainably - populations that exceed this often crash.
-
Direct counting methods (like aerial photography and census) give exact numbers, while indirect methods (like mark-recapture and quadrats) estimate population size.
-
Growth patterns show either J-shaped curves (rapid growth followed by crash) or S-shaped curves (sustainable growth that levels off at carrying capacity).