Maps That Provide Information About an Event (Grade 11 NSC Matric Mathematical Literacy): Revision Notes
Maps That Provide Information About an Event
What are event maps?
Event maps are special types of maps designed to help participants understand and prepare for sporting events like marathons, cycling races, or other competitions. These maps show important details about the route that athletes will follow during the event.
There are two main types of event maps that work together to give participants complete information about their race or competition.
Types of event maps
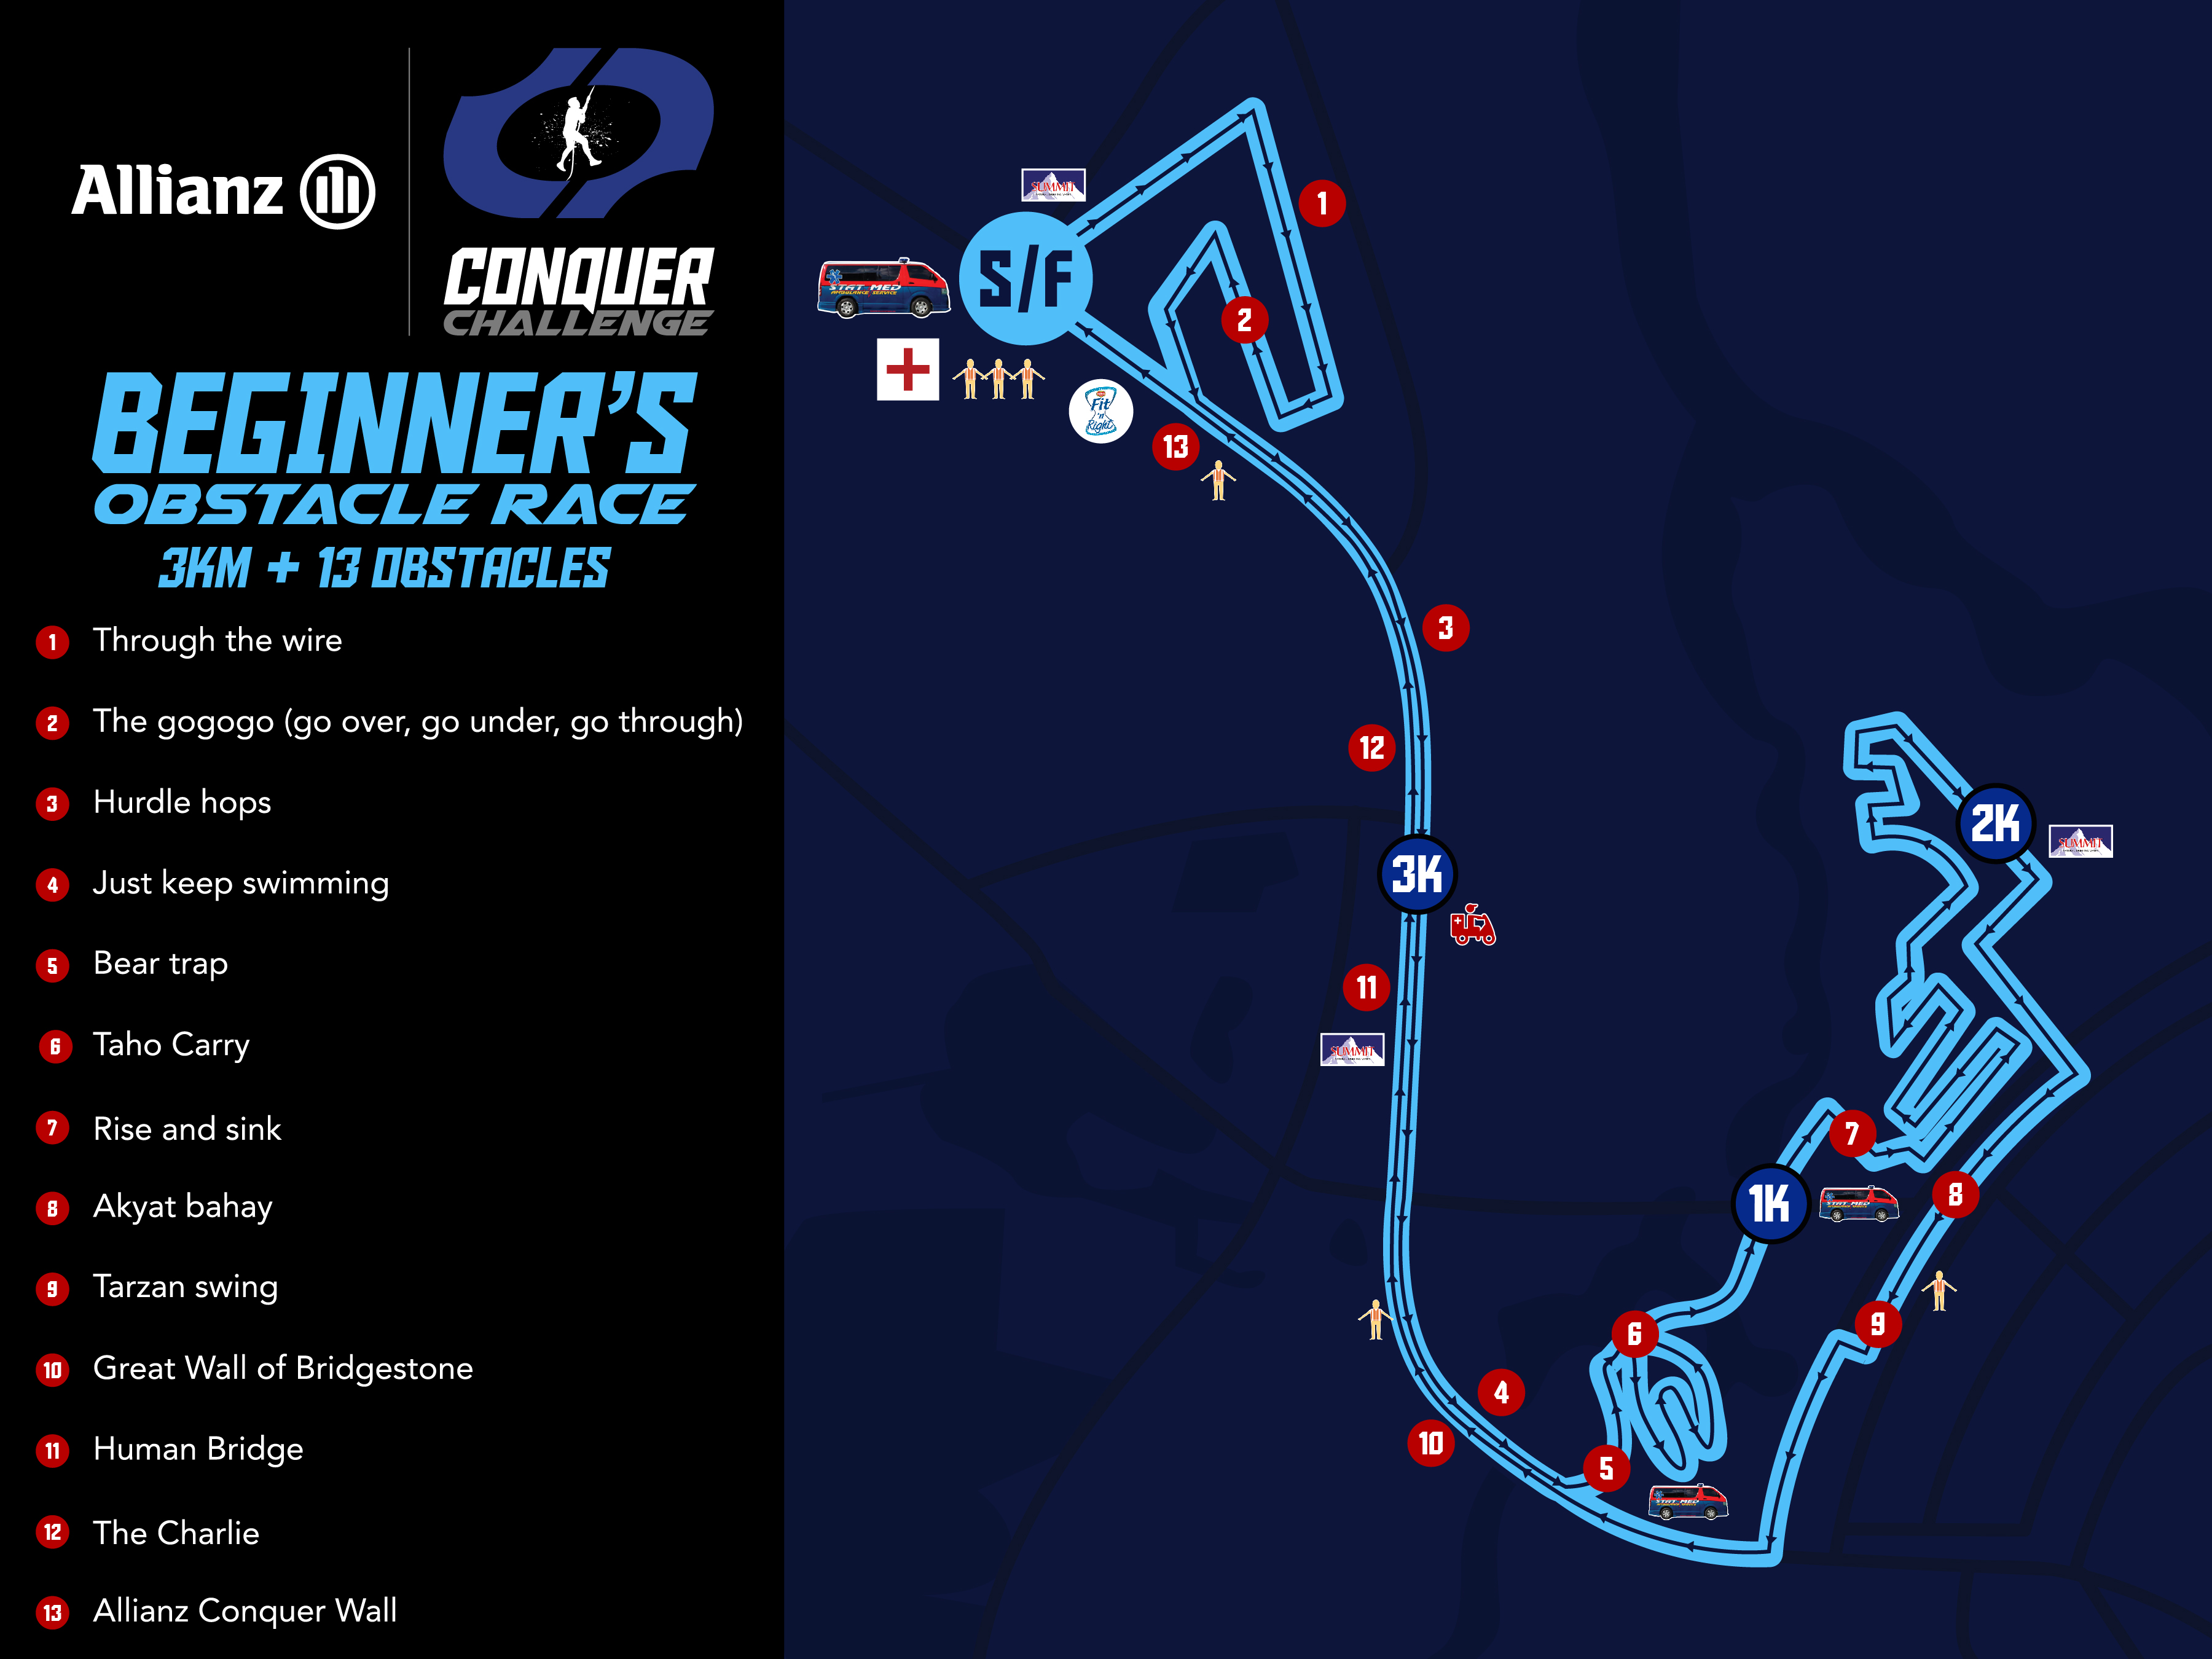
Route maps
A route map shows the path that participants will follow during an event from a bird's-eye view perspective. Think of it as looking down at the route from above, like viewing it from an aeroplane.
What route maps show:
- The exact path or course that participants must follow
- Where the route turns corners and where it goes straight
- The positions of important facilities like watering stations and first aid points
- Distance markers along the route
- Start and finish locations
Route maps are particularly useful for understanding the layout and planning where to find support during the event.
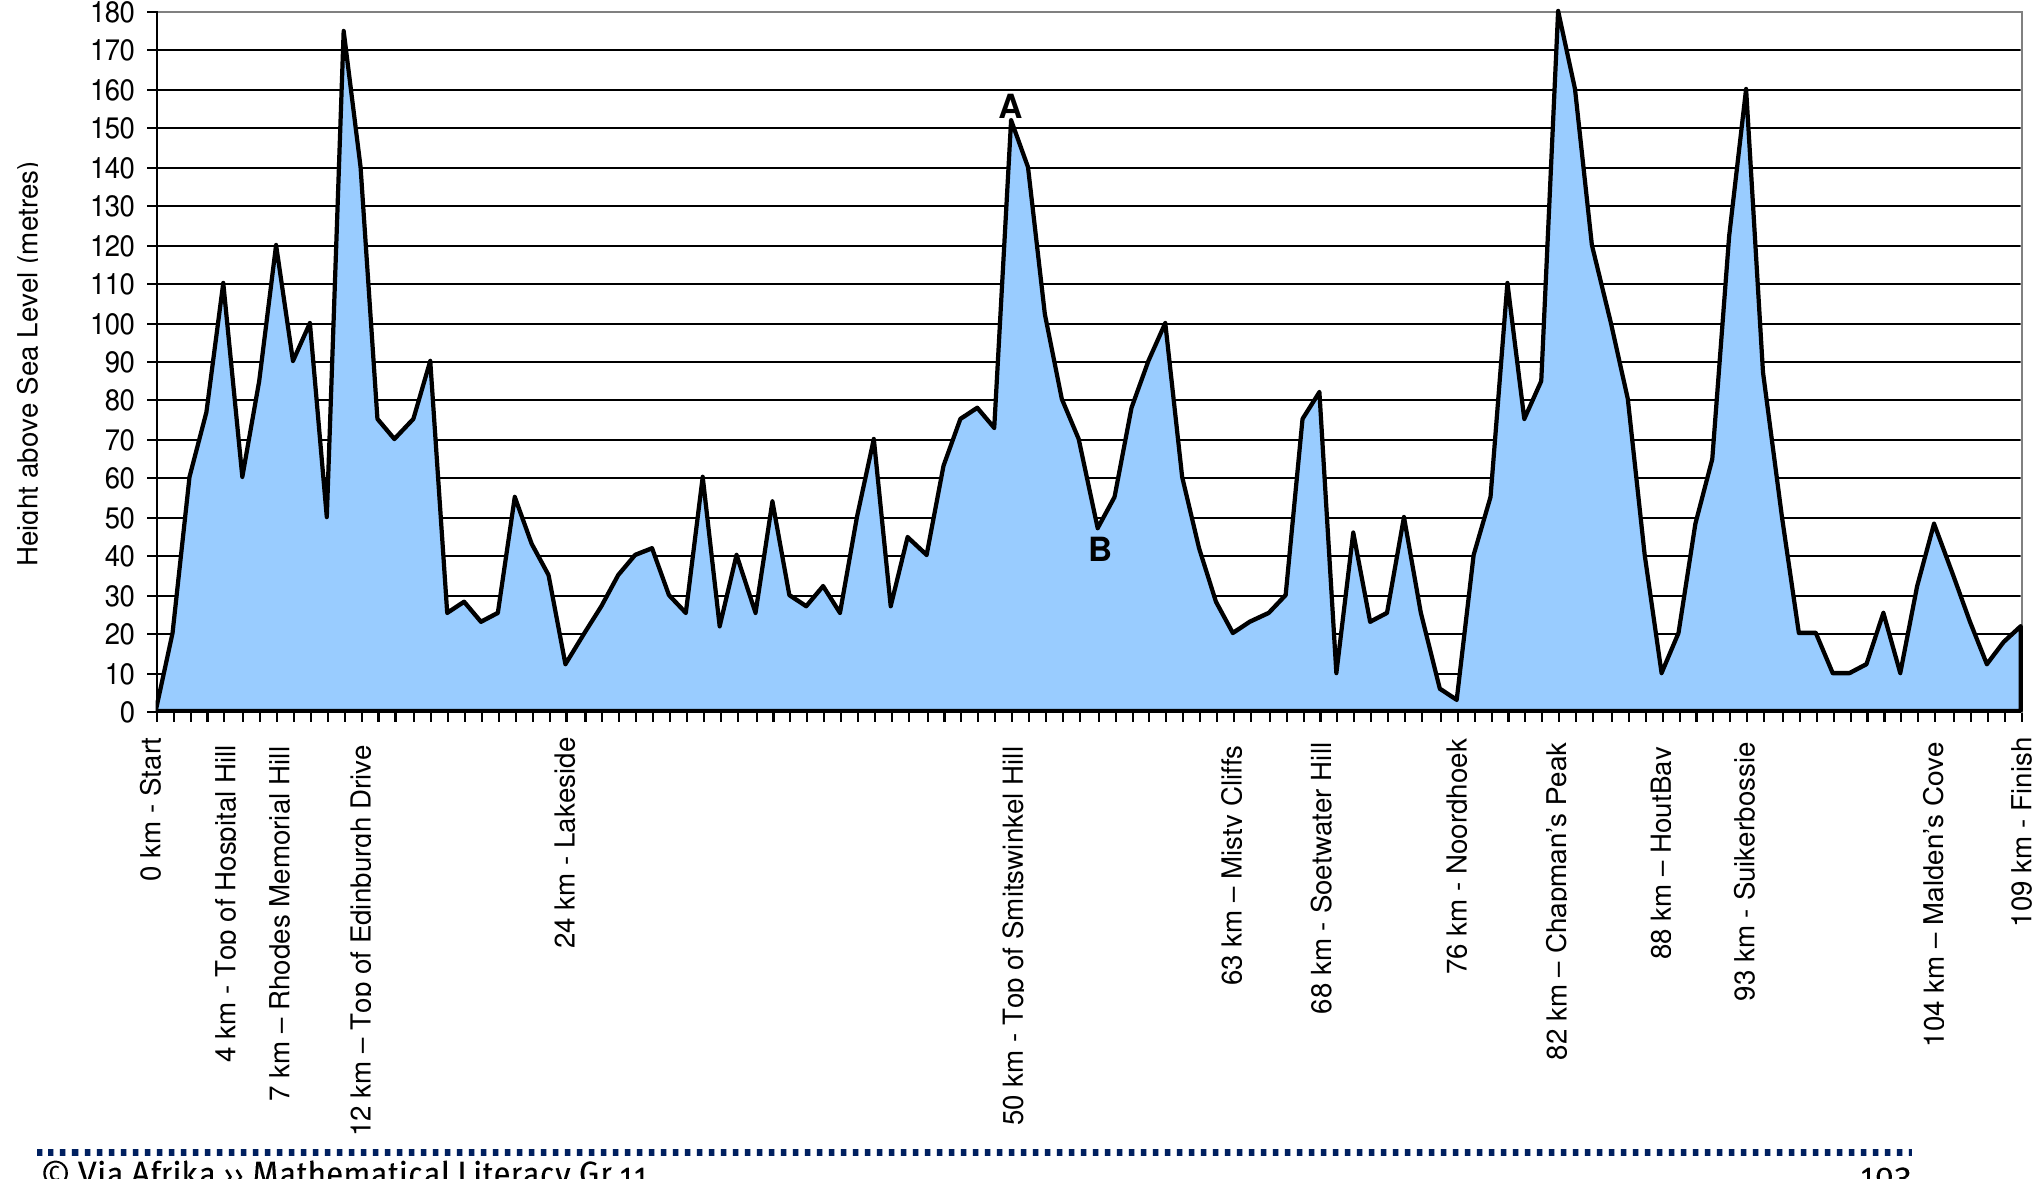
Elevation maps
An elevation map displays the same route from a side-view perspective, showing how the height above sea level changes along the course. Instead of looking down from above, you're looking at the route from the side.
What elevation maps show:
- The height profile of the entire route
- Where participants will face uphill sections (climbing)
- Where there are downhill sections (descending)
- Flat sections where the elevation stays constant
- How steep the climbs and descents are
- Distance markers can also be included
Elevation maps help athletes understand how challenging different parts of the route will be physically.
Key differences between route and elevation maps
Understanding the differences between these two map types is essential for proper event preparation:
| Aspect | Route Map | Elevation Map |
|---|---|---|
| Perspective | Top-view (looking down from above) | Side-view (looking from the side) |
| Main focus | Path layout and facilities | Height changes and terrain difficulty |
| Best for | Navigation and finding support points | Understanding physical challenges |
| Shows terrain | Corners, straight sections, distances | Hills, valleys, flat sections |
Reading elevation maps
When interpreting an elevation map, look for these key features:
Key Features to Identify:
- Steep upward slopes indicate difficult climbing sections where athletes need more energy
- Steep downward slopes show fast descent areas that may stress different muscle groups
- Flat horizontal sections represent easier portions where athletes can maintain steady pace
- The highest points show the most challenging climbs in the event
- Distance markers help athletes plan their pacing strategy
Using event maps for planning
Both types of maps are valuable tools for event preparation:
Route maps help with:
- Planning where family and supporters should wait
- Identifying where refreshment stations are located
- Understanding the overall layout of the event
- Navigation during the event
Elevation maps help with:
- Developing a pacing strategy for different terrain
- Identifying the most challenging sections to prepare for
- Planning when to conserve or use energy
- Understanding why certain parts of the route may take longer
Worked example: Interpreting race data
Let's look at how to work with event statistics:
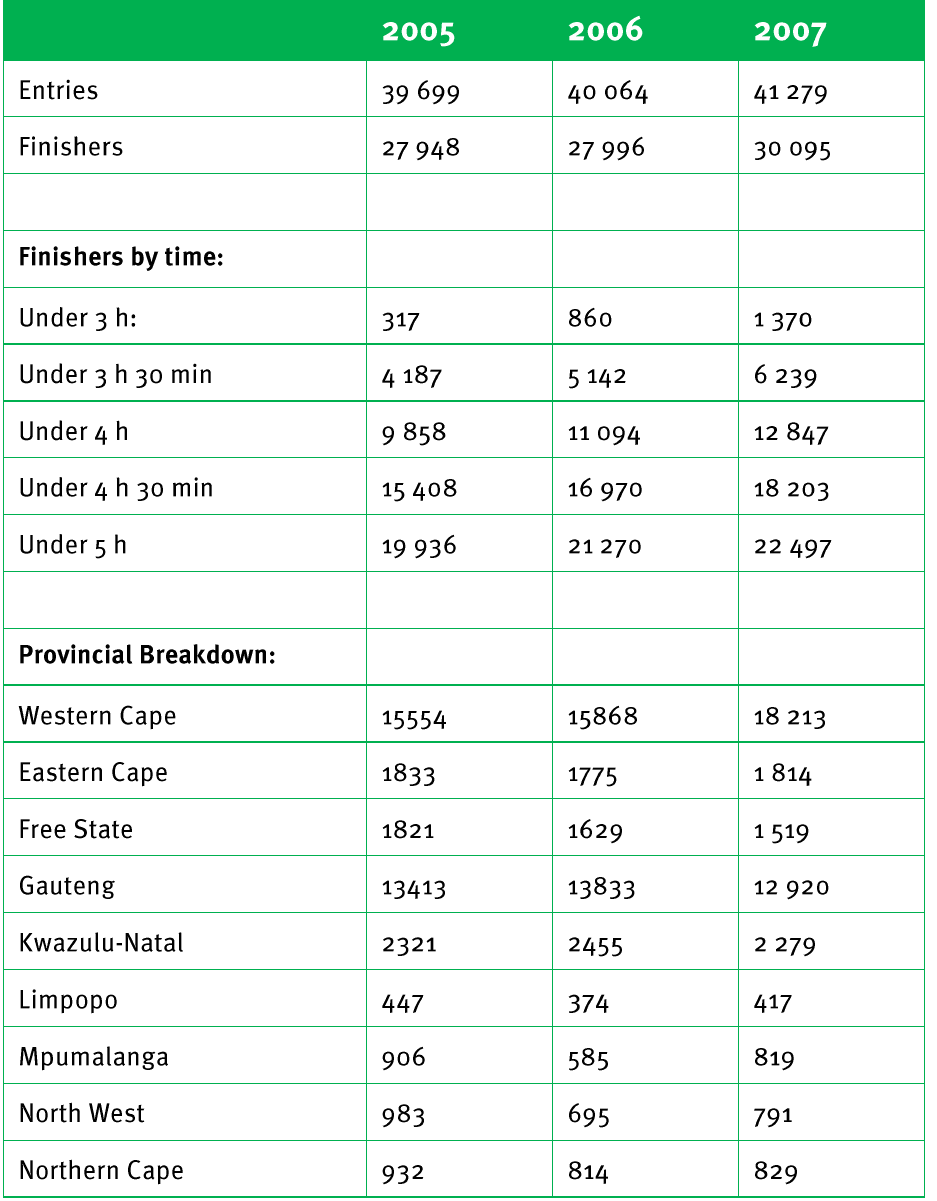
Worked Example 1: Calculating completion rates
If 41,279 people entered a race in 2007 and 30,095 finished, what percentage completed the event?
Step 1: Find the number who didn't finish Non-finishers = 41,279 - 30,095 = 11,184
Step 2: Calculate the percentage who didn't finish Percentage =
Step 3: Calculate completion rate Completion rate =
Worked Example 2: Analysing finishing times
From the 2007 data, how many cyclists finished between 4 and 4½ hours?
- Finishers under 4 hours = 12,847
- Finishers under 4½ hours = 18,203
- Finishers between 4 and 4½ hours = 18,203 - 12,847 = 5,356
Worked Example 3: Speed calculations
If a cyclist completes a 109 km race in 2 hours 27 minutes 30 seconds, what was their average speed?
Step 1: Convert time to hours 2 hours 27 minutes 30 seconds = hours
Step 2: Calculate average speed Average speed = km/h
Common Exam Tips:
- Always check whether you're looking at a route map or elevation map
- Pay attention to the scale and units used (metres, kilometres, hours)
- Look for the highest and lowest points on elevation maps
- Identify steep sections by looking for sharp changes in elevation
- Use both maps together to get complete information about an event
Key Points to Remember:
- Route maps show the path from above (top-view) with facilities and distances
- Elevation maps show height changes from the side (side-view) with hills and valleys
- Both maps work together to give complete information for event planning
- Steep sections on elevation maps indicate physically challenging parts of the route
- Event statistics can be analysed using percentages, averages, and time calculations