Types of Relationships (Grade 11 NSC Matric Mathematical Literacy): Revision Notes
Types of Relationships
Introduction to non-linear relationships
In Mathematical Literacy, you'll encounter various non-linear relationships that appear in real-world situations. These relationships don't follow straight-line patterns and include several important types:
- Constant ratio relationships - showing exponential growth patterns
- Combination relationships - featuring multiple components together
- Step function relationships - displaying jump patterns at specific intervals
- Relationships with no obvious pattern - requiring careful interpretation
Understanding these relationship types helps you interpret graphs and analyse real-world data more effectively. The key skill is recognising which type of relationship best describes a given situation.
These non-linear relationships are fundamental to understanding real-world scenarios in Mathematical Literacy. Unlike straight-line relationships, these patterns reflect how costs, growth, and pricing structures actually work in practice.
Constant ratio relationships
Definition and characteristics
A constant ratio relationship occurs when a value increases by the same percentage or factor repeatedly. Each new calculation uses the previous result as the starting point, creating a compound growth effect.
Key characteristics:
- The percentage increase stays the same each period
- Each increase is calculated on the new total (not the original amount)
- The graph shows a curved line that gets steeper over time
- We say the graph is increasing at an increasing rate
Worked example: food cost inflation
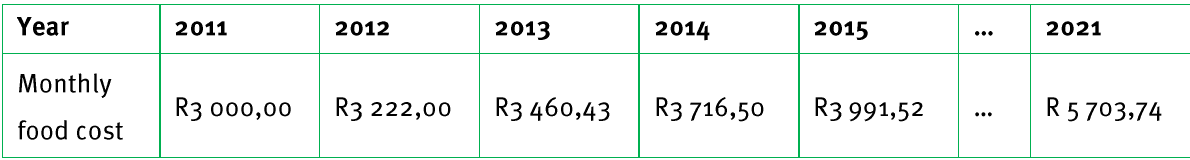
Worked Example: Food Cost Inflation Calculation
Let's examine how monthly food costs increase with 7.4% annual inflation:
Starting value: Monthly food cost in 2011 = R3,000.00
Year 2012 calculation:
- Increase = 7.4% × R3,000.00 = R222.00
- New cost = R3,000.00 + R222.00 = R3,222.00
Year 2013 calculation:
- Increase = 7.4% × R3,222.00 = R238.43
- New cost = R3,222.00 + R238.43 = R3,460.43
Notice how the rand amount of increase gets bigger each year even though the percentage stays at 7.4%.
Graph interpretation
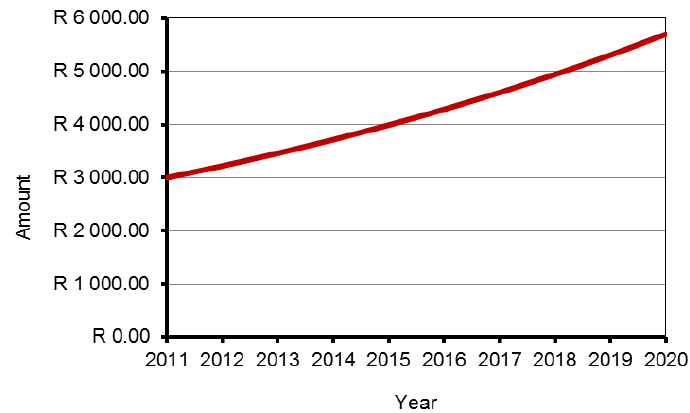
The graph of a constant ratio relationship shows:
- A curved line that starts relatively flat
- The curve gets steeper as time progresses
- This happens because each year's increase is larger than the previous year's increase
- The shape is not a straight line
Combinations of relationships
Definition and characteristics
Combination relationships occur when a situation involves multiple pricing components working together. These often combine:
- A fixed fee (showing as a flat horizontal line)
- A variable charge (showing as a sloping line)
Worked example: cell phone contract
Consider this cell phone pricing structure:
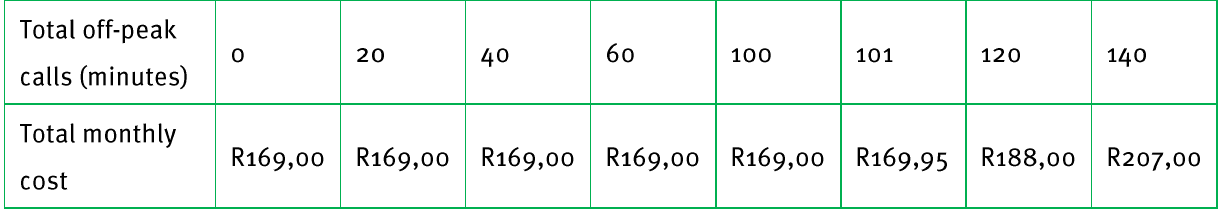
Worked Example: Cell Phone Contract Analysis
Analysis of the pricing:
- For 0-100 minutes: Cost stays at R169.00 (fixed monthly fee)
- After 100 minutes: Additional charge of R0.95 per minute applies
- At 120 minutes: R169.00 + (20 × R0.95) = R188.00
- At 140 minutes: R169.00 + (40 × R0.95) = R207.00
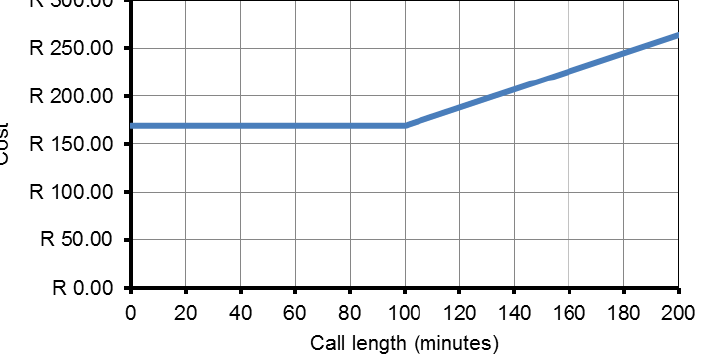
Graph interpretation
The combination relationship graph shows two distinct sections:
- Flat portion (0-100 minutes): Represents the fixed monthly subscription fee with 100 free minutes included
- Sloping portion (after 100 minutes): Shows the additional per-minute charges that increase the total cost
This creates a graph that looks like it has two different "personalities" - flat then increasing.
Step functions
Definition and characteristics
A step function creates a graph that looks like a staircase. Key features include:
- The same fee applies to entire time intervals
- Fees jump to new levels at specific boundary points
- Within each interval, the cost remains constant
- The graph shows horizontal lines with vertical jumps
Worked example: parking fees
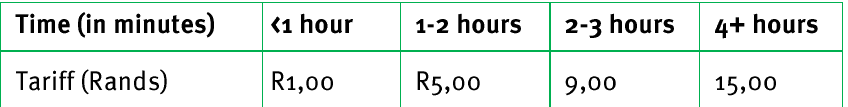
Worked Example: Parking Fee Structure
Analysis of the fee structure:
- Less than 1 hour (0-59 minutes): R1.00
- 1-2 hours (60-119 minutes): R5.00
- 2-3 hours (120-179 minutes): R9.00
- 4+ hours (240+ minutes): R15.00
Important exam point: Someone parking for 45 minutes pays R1.00, but someone parking for 61 minutes pays R5.00 - there's a big jump in cost at the 1-hour boundary.
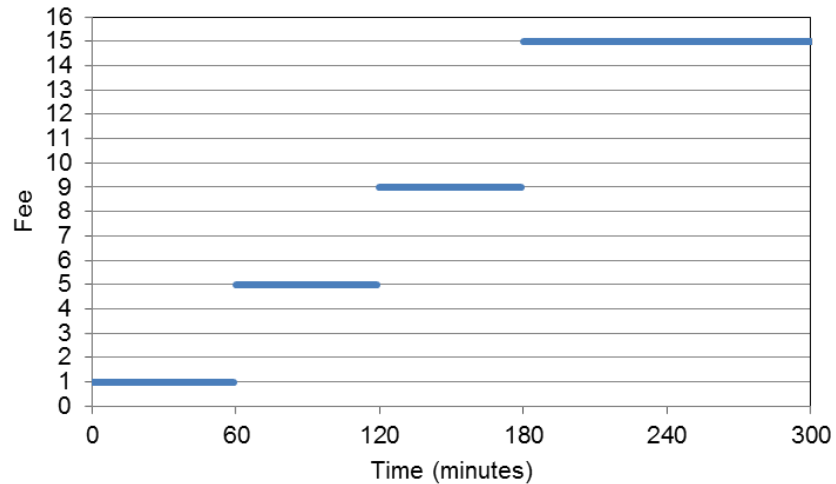
Graph characteristics
The step function graph shows:
- Horizontal line segments representing constant fees within time intervals
- Vertical jumps between different fee levels
- No connecting lines between the steps (showing the fees are completely separate)
- A "staircase" appearance overall
Relationships with no obvious pattern or formula
Sometimes you'll encounter situations where:
- No clear mathematical formula is immediately obvious
- The relationship doesn't fit standard patterns
- You must still be able to draw and interpret the graph
Exam strategy: Focus on:
- Understanding what the situation represents
- Identifying key points and trends
- Drawing a reasonable graph based on the given information
- Making sensible interpretations even without a formula
Remember!
Key Points to Remember:
- Constant ratio relationships show compound growth with curved graphs that get steeper over time
- Combination relationships feature multiple components creating graphs with both flat and sloping sections
- Step functions create staircase-like graphs with horizontal segments and vertical jumps at boundaries
- All relationship types can be interpreted and graphed even when no obvious formula exists
- Exam tip: Always consider what each portion of a graph represents in the real-world context