Working With Two Relationships on a Set of Axes (Grade 11 NSC Matric Mathematical Literacy): Revision Notes
Working With Two Relationships on a Set of Axes
What is a point of intersection?
When you have two graphs plotted on the same set of axes, they may cross or meet at a specific point. This point is called the point of intersection. At this point, both relationships have exactly the same value for both the x-axis (horizontal) and y-axis (vertical) variables.
The point of intersection is significant because it shows you exactly where two different situations become equal. For example, it might show you when two different payment plans cost the same amount, or when two people travelling at different speeds will be at the same distance.
Key components of intersection points
Every point of intersection consists of two values:
- Horizontal value - read from the x-axis
- Vertical value - read from the y-axis
These two values together tell you the exact conditions where both relationships are equal.
Finding intersection points from graphs
The most straightforward way to find an intersection point is to look at the graph where the two lines cross each other. Let's examine an example using electricity billing systems.
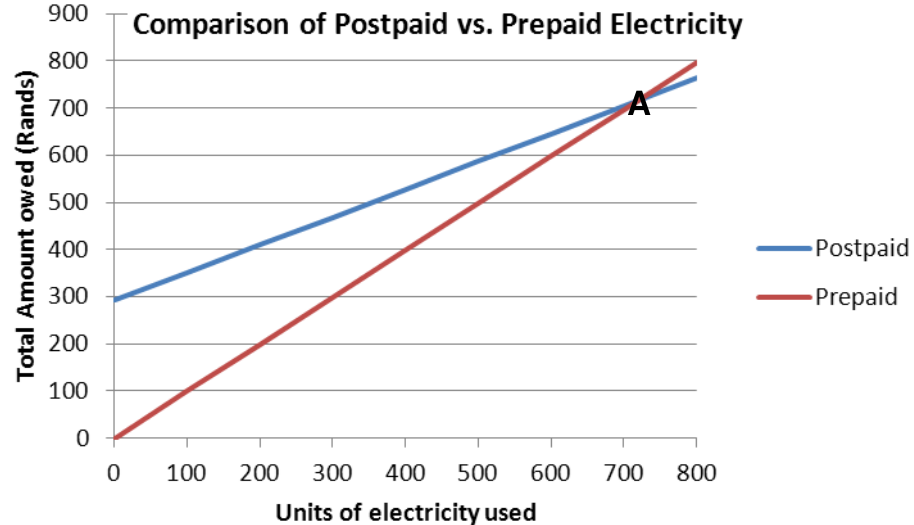
In this electricity billing comparison, the intersection point (marked as point A) shows where postpaid and prepaid electricity systems cost exactly the same amount.
From this graph, we can read that:
- The intersection occurs at approximately 720 units of electricity used (horizontal axis)
- At this point, both systems cost approximately R720 (vertical axis)
This means that if you use exactly 720 units of electricity, both the postpaid and prepaid systems will cost you the same amount of money.
Using equations and trial and improvement method
Sometimes you need to find the intersection point more precisely than what you can read from a graph. This is where the trial and improvement method becomes useful.
The trial and improvement process
This method involves:
- Looking at the graph to estimate where the intersection might be
- Choosing a test value near that estimate
- Substituting this value into both equations
- Comparing the results from both equations
- Adjusting your test value based on whether the results are too high or too low
- Repeating until you find values that give the same result for both equations
Worked Example: Electricity Billing Systems
Let's use the electricity example with these equations:
- Postpaid: Total Cost =
- Prepaid: Total Cost =
From the graph, we can see the lines cross slightly after 700 units. Let's test some values:
Testing 710 units:
- Postpaid:
- Prepaid:
The postpaid option is more expensive, so we need a higher value.
Testing 715 units:
- Postpaid:
- Prepaid:
Still slightly different, but getting closer.
Testing 720 units:
- Postpaid:
- Prepaid:
Very close! With more precise testing, we can find that both systems cost R719,91 when using 719.9 units.
Break-even analysis applications
One of the most important applications of intersection points is in break-even analysis for businesses. The break-even point shows exactly where a business's income equals its costs - meaning they're not making a profit or a loss.
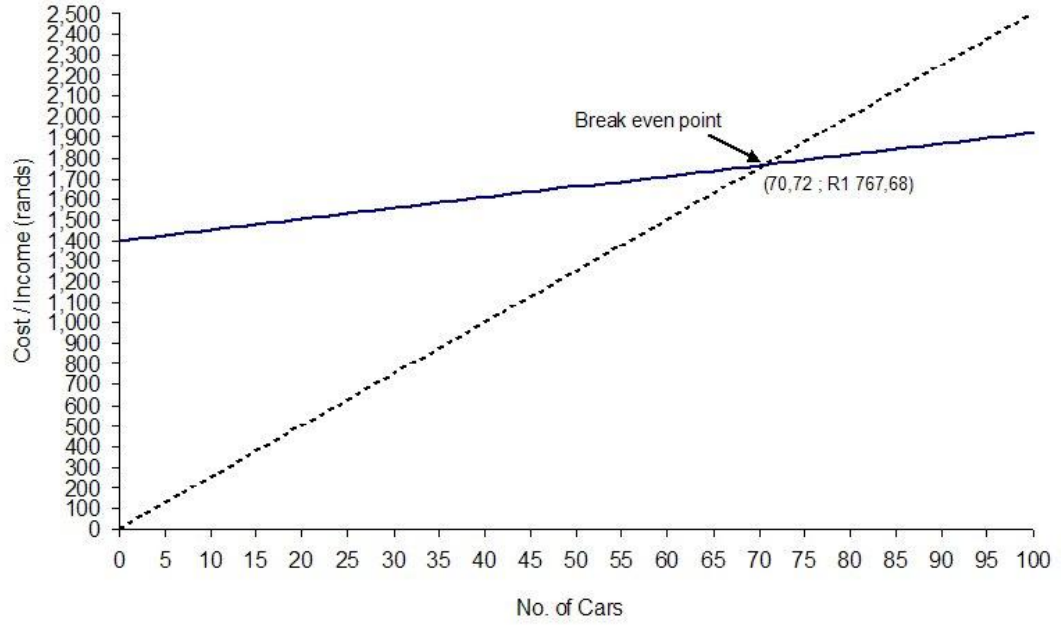
This graph shows a clear break-even analysis where:
- The intersection point is labeled and marked with coordinates (70.72, R1 767.68)
- This means the business breaks even when selling approximately 71 cars
- At this point, both costs and income equal approximately R1 768
Worked example: car wash business
Let's examine a practical business example to understand how intersection points help with decision-making.
Worked Example: Milton's Car Wash Business
Business details:
- Fixed monthly expenses: R1 400 (salaries)
- Variable cost per car: R5.20 (water, soap, electricity)
- Income per car washed: R25.00
Setting up the equations:
- Monthly costs =
- Monthly income =
Using trial and improvement, we find that Milton breaks even at 71 cars per month, generating R1 775 in income to cover his costs.
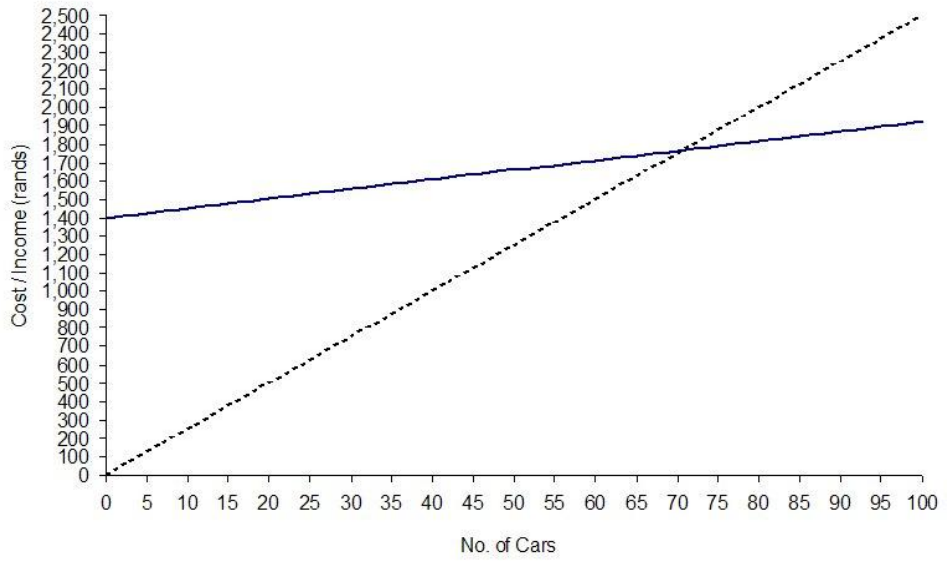
The graph shows how the dotted line (income) starts at zero and increases steeply, while the solid line (costs) starts at R1 400 (the fixed costs) and increases more gradually. Where these lines meet is Milton's break-even point.
Understanding regions around intersection points
The intersection point divides the graph into different regions that have important meanings:
Before the intersection point:
- In the car wash example, when fewer than 71 cars are washed, costs are higher than income (making a loss)
- In the electricity example, when using less than 720 units, one system is cheaper than the other
After the intersection point:
- When more than 71 cars are washed, income exceeds costs (making a profit)
- When using more than 720 units, the other electricity system becomes cheaper
Distance and time applications
Intersection points are also useful for solving problems involving movement and time.
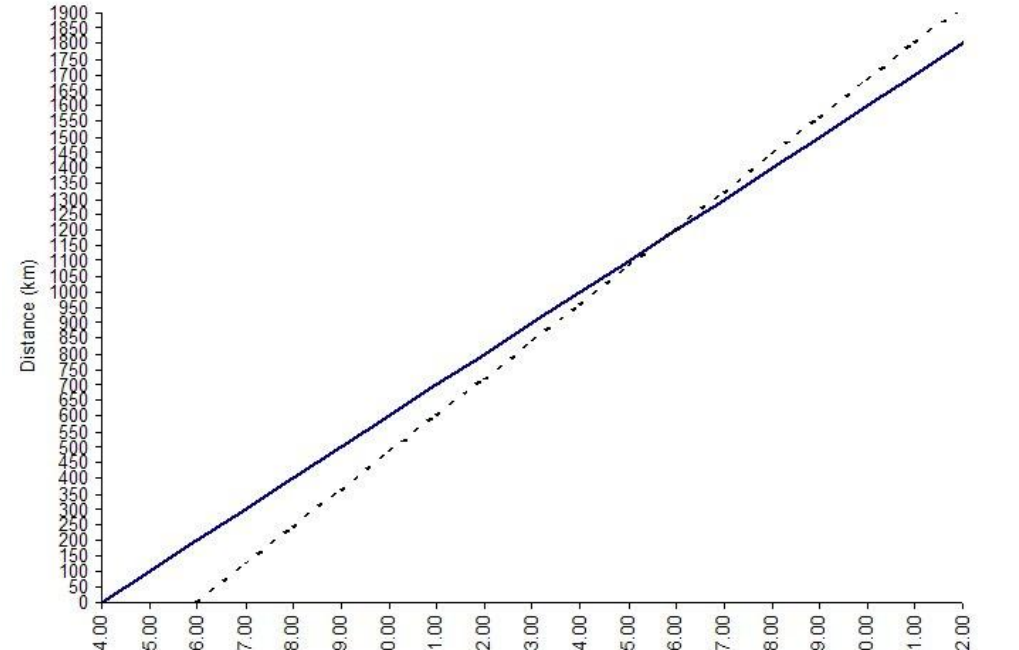
This type of graph can show when two people travelling at different speeds will meet, or when one person will overtake another. The intersection point tells you both the time when this happens and how far they will have travelled.
Exam tips for intersection points
Essential Exam Tips:
- Always read both values: Remember that intersection points have both x and y coordinates
- Estimate first: Use the graph to make a reasonable estimate before using trial and improvement
- Show your working: In exam questions, demonstrate your trial and improvement process step by step
- Check your context: Make sure your answer makes sense in the real-world situation described
- Use appropriate units: Include the correct units (rands, kilometres, hours, etc.) in your final answer
Key Points to Remember:
- Point of intersection occurs where two graphs cross and have equal x and y values
- Trial and improvement involves testing values systematically until both equations give the same result
- Break-even points show where business costs equal income - a crucial decision-making tool
- Both coordinates matter - always identify both the horizontal and vertical values at intersection points
- Real-world context gives meaning to intersection points, whether it's costs, distances, or time