Timelines (Grade 11 NSC Matric Mathematics): Revision Notes
Timelines
Introduction to timelines
Timelines are visual tools that help us organise and solve complex financial problems involving interest calculations over multiple time periods. They show when money is invested, when additional deposits or withdrawals occur, and when interest rates change.
When working with compound interest calculations that occur more than once per year, we need to understand how compounding frequency affects our calculations. This is where the concept of p-values becomes essential.
Timelines transform complex financial scenarios into visual representations, making it easier to track multiple transactions and varying interest rates across different time periods.
Understanding compounding frequency
Different investment accounts compound interest at various intervals throughout the year. The table below shows the most common compounding frequencies and their corresponding p-values:
Compounding Frequency Reference Table
| Term | p |
|---|---|
| Yearly/annually | 1 |
| Half-yearly/bi-annually | 2 |
| Quarterly | 4 |
| Monthly | 12 |
| Weekly | 52 |
| Daily | 365 |
Key rule: When interest compounds more frequently than annually, we multiply the number of years by p and divide the interest rate by p.
This means: and
How to construct and use timelines
Setting up a proper timeline is crucial for solving complex financial problems. Follow these steps:
- Draw a horizontal line with time markers (, etc.)
- Mark the starting point () and show the initial amount
- Identify when deposits, withdrawals, or interest rate changes occur
- Label each time period with the relevant interest rate and compounding frequency
- Break the problem into sections if interest rates or conditions change
The key to successful timeline construction is methodical planning - always identify all transactions and rate changes before beginning your calculations.
Worked example 1: Simple vs compound interest
Worked Example: Mixed Interest Types
Problem: R 5500 is invested for 4 years. For the first year, it earns 11% p.a. simple interest, then 12.5% p.a. compounded quarterly for the remaining 3 years. Find the final value.
Solution:
Step 1: Draw timeline and identify variables
The timeline shows (start), (end of year 1), and (end of year 4).
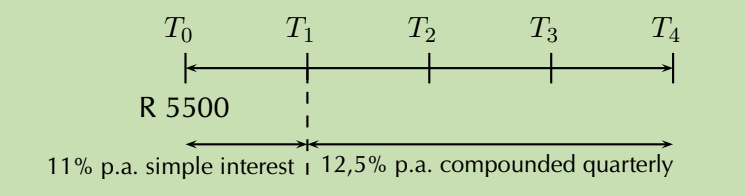
Step 2: Calculate value at using simple interest
Using the simple interest formula:
Step 3: Calculate compound interest from to
Since interest compounds quarterly for 3 years:
- periods
- per quarter
The accumulated amount from becomes the new principal:
Step 4: Final answer
The investment value after 4 years is R 8831.88.
Worked example 2: Multiple deposits with rate changes
Worked Example: Multiple Deposits with Changing Rates
Problem: R 150 000 is invested for 6 years at 12% p.a. compounded half-yearly for the first 4 years, then 8.5% p.a. compounded yearly. Additional deposits of R 8000 (after 1 year) and R 2000 (after 5 years) are made.
Solution:
Step 1: Set up timeline
Timeline shows: (start), (+R 8000), (rate change), (+R 2000), (end).
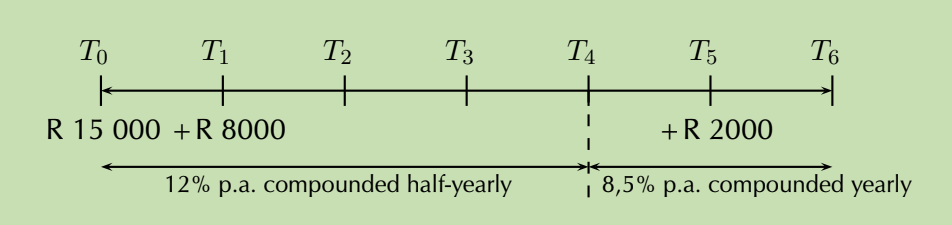
Step 2: Calculate initial deposit growth
From to (4 years, half-yearly compounding):
- periods
From to (2 years, yearly compounding):
- periods
Total growth:
Step 3: Calculate R 8000 deposit growth
This deposit grows for 5 years total:
- 3 years at 12% half-yearly: ,
- 2 years at 8.5% yearly: ,
Step 4: Calculate R 2000 deposit growth
This deposit grows for only 1 year at 8.5%:
Step 5: Final calculation
Total value = Initial deposit growth + R 8000 deposit growth + R 2000 deposit growth
Worked example 3: Withdrawals and rate changes
Worked Example: Handling Withdrawals
Problem: R 60 000 is invested at 7% p.a. compounded quarterly for 18 months, then 5% p.a. compounded monthly. After 3 years, R 5000 is withdrawn. What remains after 5 years?
Solution:
Step 1: Set up timeline
Timeline shows rate change at 18 months () and withdrawal at 3 years ().
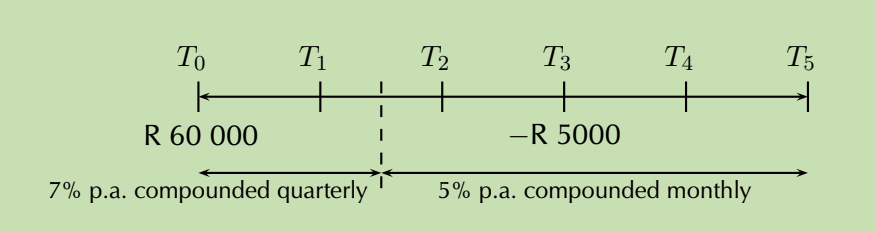
Step 2: Calculate initial growth
First 1.5 years (quarterly): ,
Next 3.5 years (monthly): ,
Growth without withdrawal:
Step 3: Account for withdrawal
We must subtract both the R 5000 withdrawn and the interest it would have earned:
Interest the R 5000 would have earned over final 2 years:
Step 4: Final calculation
Final amount = Growth without withdrawal - R 5000 - Interest on withdrawn amount
Key exam tips
Critical Exam Strategies:
- Always draw a timeline first - this prevents confusion and helps identify all time periods
- Identify rate changes carefully - note exactly when interest rates change
- Handle deposits and withdrawals separately - calculate their individual growth/impact
- Check your p-values - ensure you're using the correct compounding frequency
- Break complex problems into parts - solve each section of the timeline separately
- Use calculator memory functions - avoid rounding intermediate results
Key Points to Remember:
-
Timelines are essential tools for visualising complex financial scenarios with multiple time periods, rate changes, and transactions
-
The p-value determines compounding frequency - yearly (1), half-yearly (2), quarterly (4), monthly (12), weekly (52), daily (365)
-
When rates change mid-problem, treat each time period separately and use the accumulated amount from one period as the principal for the next
-
Additional deposits and withdrawals must be tracked individually and their growth calculated from their entry/exit points
-
Always verify your timeline setup before beginning calculations to ensure all deposits, withdrawals, and rate changes are correctly positioned