Functions (Grade 11 NSC Matric Mathematics): Revision Notes
Quadratic Functions
A quadratic function is a type of polynomial function that creates a U-shaped curve called a parabola. These functions are essential in many areas of mathematics and have distinctive characteristics that make them easy to identify and work with.
Basic form: y = ax² + q
The simplest form of a quadratic function is , where and are constants.
Understanding the effects of parameters and is fundamental to working with quadratic functions. These parameters control the basic shape and position of the parabola.
Effects of parameter a
The value of a determines the shape and direction of the parabola:
-
When a > 0: The parabola opens upward (smiles) and has a minimum turning point
- As increases, the parabola becomes narrower
- As approaches 0, the parabola becomes wider
-
When a < 0: The parabola opens downward (frowns) and has a maximum turning point
- As increases, the parabola becomes narrower
- As approaches 0, the parabola becomes wider
Effects of parameter q
The value of q causes a vertical shift of the parabola:
- When q > 0: The parabola shifts upward by q units
- When q < 0: The parabola shifts downward by |q| units
- q is also the y-intercept of the parabola
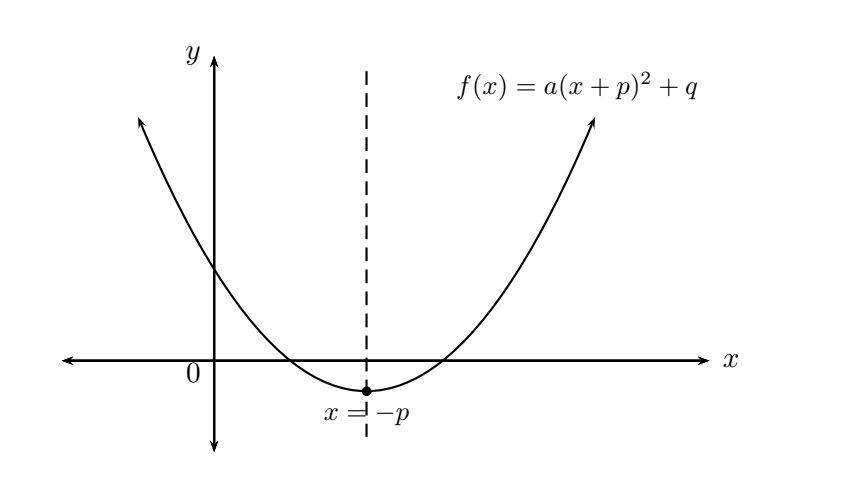
General form: y = a(x + p)² + q
The complete form of a quadratic function is , where , , and are constants.
Effects of parameter p
The value of p causes a horizontal shift of the parabola:
- When p > 0: The parabola shifts to the left by p units
- When p < 0: The parabola shifts to the right by |p| units
The direction of horizontal shift is opposite to the sign of p in the equation. This is a common source of confusion for students.
Combined effects
The parameters work together to transform the basic parabola :
- a: Controls width and direction (up or down opening)
- p: Controls horizontal position (left or right shift)
- q: Controls vertical position (up or down shift)
Key characteristics
Understanding the key characteristics of quadratic functions allows you to analyze and sketch them effectively.
Domain and range
For any quadratic function :
-
Domain: (all real numbers)
- There is no value of x for which the function is undefined
-
Range: Depends on the value of a
- If : Range is or
- If : Range is or
Worked Example: Domain and Range
Question: State the domain and range for .
Solution:
Step 1: Determine the domain
The domain is because there is no value of x for which is undefined.
Step 2: Determine the range
Since , the parabola opens downward and has a maximum turning point.
The range can be calculated from:
Therefore the range is or in interval notation .
Intercepts
Y-intercept
To find the y-intercept, substitute into the equation.
For example, for :
- The y-intercept is .
X-intercepts
To find the x-intercepts, substitute and solve for x.
For example, for :
Since this equation has no real solutions, the graph lies above the x-axis and has no x-intercepts.
Turning point
The turning point (or vertex) of is at .
- If : The turning point is a minimum with range
- If : The turning point is a maximum with range
Converting to vertex form
To find the turning point when the function is in standard form , use completing the square:
Worked Example: Finding Turning Point
Question: Determine the turning point of .
Solution:
Step 1: Write in the form using completing the square
Step 2: Identify the turning point
From , the turning point is .
Axis of symmetry
The axis of symmetry for is the vertical line .
This line passes through the turning point and divides the parabola into two equal halves.
Sketching quadratic functions
To sketch graphs of the form , determine these five characteristics:
- Sign of a (determines if parabola opens up or down)
- Turning point
- Y-intercept (substitute )
- X-intercepts (substitute and solve)
- Domain and range
Worked Example: Sketching a Parabola
Question: Sketch the graph of .
Solution:
Step 1: Examine the equation
Since , the parabola opens downward and has a maximum turning point.
Step 2: Determine the turning point
From the equation, the turning point is .
Step 3: Determine the axis of symmetry
The axis of symmetry is .
Step 4: Determine the y-intercept
- Y-intercept:
Step 5: Determine the x-intercepts
Since this has no real solutions, there are no x-intercepts.
Step 6: State domain and range
- Domain:
- Range:
Transformations and shifts
Understanding how to apply transformations to quadratic functions is essential for working with more complex problems.
Horizontal shifts
- Right shift by m units: Replace with
- Left shift by m units: Replace with
Vertical shifts
- Upward shift by n units: Replace with
- Downward shift by n units: Replace with
Worked Example: Shifting a Parabola
Question: Given , find the equation if the parabola is shifted 1 unit right and 3 units down.
Solution:
Step 1: Apply horizontal shift (1 unit right)
Replace with :
Step 2: Apply vertical shift (3 units down)
Replace with :
Finding equations from graphs
When you need to find the equation of a quadratic function from its graph, you can use different approaches depending on what information is given.
When x-intercepts are given
Use where and are the x-intercepts.
When turning point is given
Use where is the turning point.
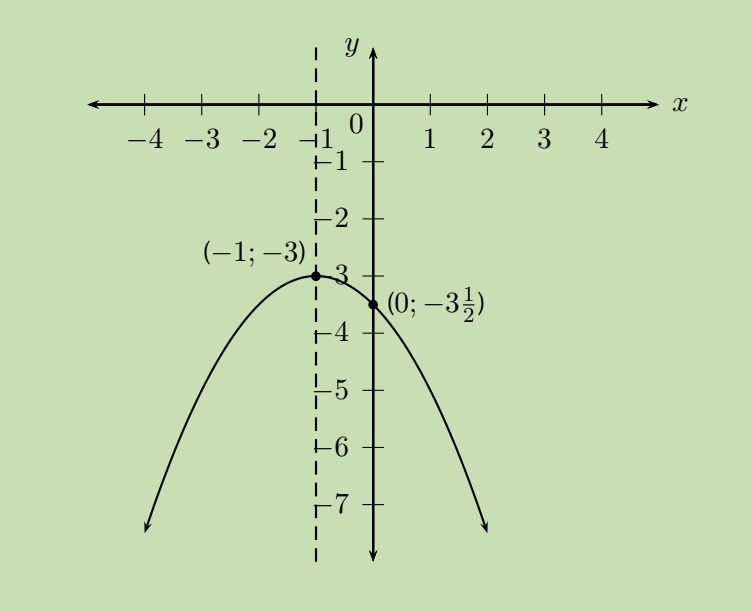
Worked Example: Finding Equation from Turning Point
Question: Find the equation of a parabola with turning point that passes through .
Solution:
Step 1: Use the vertex form
Since the turning point is :
Step 2: Find the value of a
Substitute the point :
Step 3: Write the final equation
Key Points to Remember:
- The coefficient a determines the direction and width of the parabola (positive = upward opening, negative = downward opening)
- The turning point of is always at
- The axis of symmetry is the vertical line
- Horizontal shifts work opposite to the sign (positive p shifts left, negative p shifts right)
- When sketching, always find the turning point, intercepts, and determine the domain and range