Hyperbolic Functions (Grade 11 NSC Matric Mathematics): Revision Notes
Hyperbolic Functions
Introduction to hyperbolic functions
Hyperbolic functions are functions that have the general form , where and are constants. These functions create curved graphs that have two separate branches and approach certain lines (called asymptotes) but never actually touch them.
The most basic hyperbolic function is , which you can think of as the "parent function" for all hyperbolic functions.
About Asymptotes: Asymptotes are invisible boundary lines that the graph approaches infinitely close to, but never actually touches or crosses. Think of them as "forbidden zones" for the function's graph.
Functions of the form
Effects of parameter (vertical shifts)
The parameter controls the vertical shift of the hyperbola:
- When , the graph shifts upwards by units
- When , the graph shifts downwards by units
- The horizontal asymptote becomes the line
- The vertical asymptote remains the line (the y-axis)
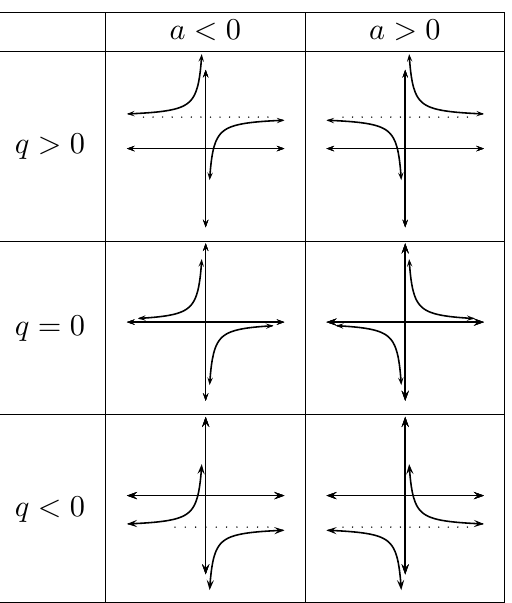
Effects of parameter (shape and quadrants)
The parameter affects both the shape and position of the hyperbola:
Understanding Parameter
When :
- The hyperbola lies in the first and third quadrants
- As increases, the branches move further away from both axes
- As approaches 0, the branches move closer to the axes
When :
- The hyperbola lies in the second and fourth quadrants
- As increases, the branches move further away from both axes
- As approaches 0, the branches move closer to the axes
Functions of the form
The extended form includes parameter , which creates horizontal shifts.
Effects of parameter (horizontal shifts)
The parameter causes a horizontal shift of the entire graph:
- When , the graph shifts left by units
- When , the graph shifts right by units
- The vertical asymptote becomes the line
- The horizontal asymptote remains
Critical Point About Horizontal Shifts: Notice that when , the graph shifts LEFT, not right! This is because the function is , so to make the denominator zero, we need . This is a common source of confusion.
Combined effects of all parameters
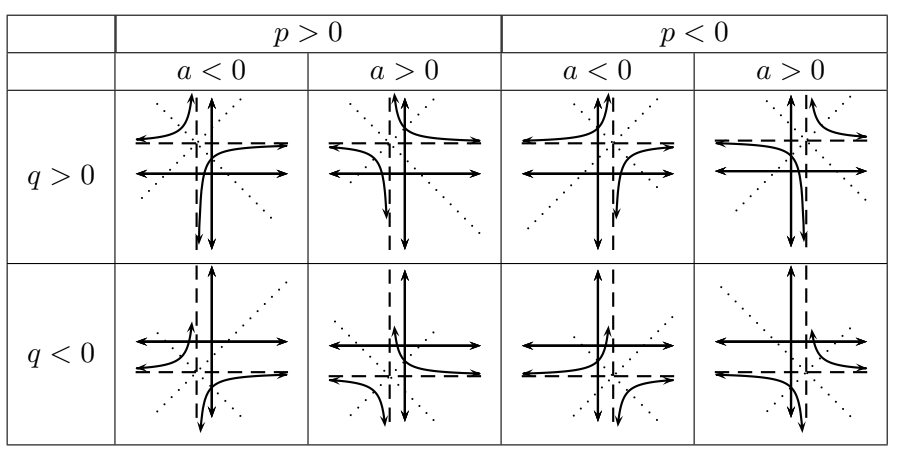
The diagram above shows how different combinations of , , and values affect the hyperbola's position and orientation.
Key characteristics of hyperbolic functions
Domain and range
For a function :
Domain:
- The domain excludes because this makes the denominator zero, causing the function to be undefined
Range:
- The range excludes because the horizontal asymptote can never be reached
Worked Example 1: Domain and Range
Question: Determine the domain and range for
Solution:
Step 1: Determine the domain
The domain is since is undefined for .
Step 2: Determine the range
Let :
Therefore the range is .
Intercepts
Understanding how to find intercepts is essential for graphing hyperbolic functions.
Finding the y-intercept:
- Set and solve for .
For example, if :
- This gives the y-intercept .
Finding the x-intercept:
- Set and solve for .
Using the same example:
This gives the x-intercept .
Asymptotes
Asymptotes are lines that the graph approaches but never touches.
For :
- Horizontal asymptote:
- Vertical asymptote:
These asymptotes represent the values excluded from the range and domain respectively.
Axes of symmetry
Hyperbolic functions have two axes of symmetry that intersect at the point .
For the standard hyperbola , the axes of symmetry are:
For the shifted hyperbola , the axes of symmetry intersect at .
Worked Example 2: Axes of Symmetry
Question: Determine the axes of symmetry for
Solution:
Step 1: Determine the intersection point
From the equation we see that and . So the axes of symmetry will intersect at .
Step 2: Define two straight line equations
- and
Step 3: Solve for and
Using to solve for :
Using to solve for :
Step 4: Write the final answer
The axes of symmetry are: and
Sketching hyperbolic graphs
To sketch a hyperbola of the form , follow these systematic steps:
- Identify the quadrants (based on the sign of )
- Find the asymptotes ( and )
- Calculate the y-intercept (let )
- Calculate the x-intercept (let )
- Determine domain and range
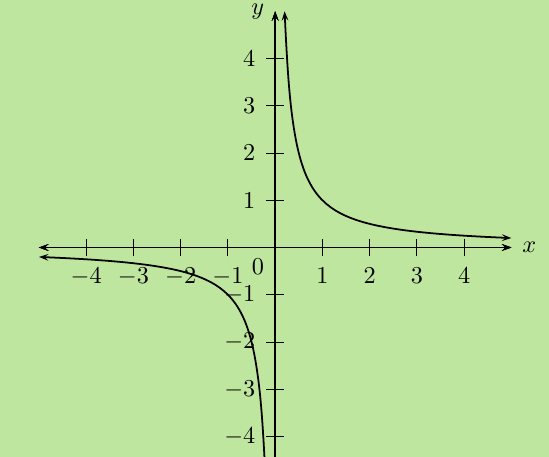
Worked Example 3: Sketching a Hyperbola
Question: Sketch the graph of . Determine the intercepts, asymptotes and axes of symmetry.
Solution:
Step 1: Examine the equation
We notice that , therefore the graph will lie in the first and third quadrants.
Step 2: Determine the asymptotes
From the equation we know that and .
Therefore the horizontal asymptote is and the vertical asymptote is .
Step 3: Determine the y-intercept
The y-intercept is obtained by letting :
- This gives the point .
Step 4: Determine the x-intercept
The x-intercept is obtained by letting :
This gives the point .
Step 5: Determine the axes of symmetry
Using to solve for the axes of symmetry:
- and
Step 6: Plot the points and sketch the graph
Step 7: State the domain and range
Domain:
Range:
Using transformations to sketch graphs
An alternative approach to sketching hyperbolic functions is to use transformations of the parent function .
Worked Example 4: Using Transformations
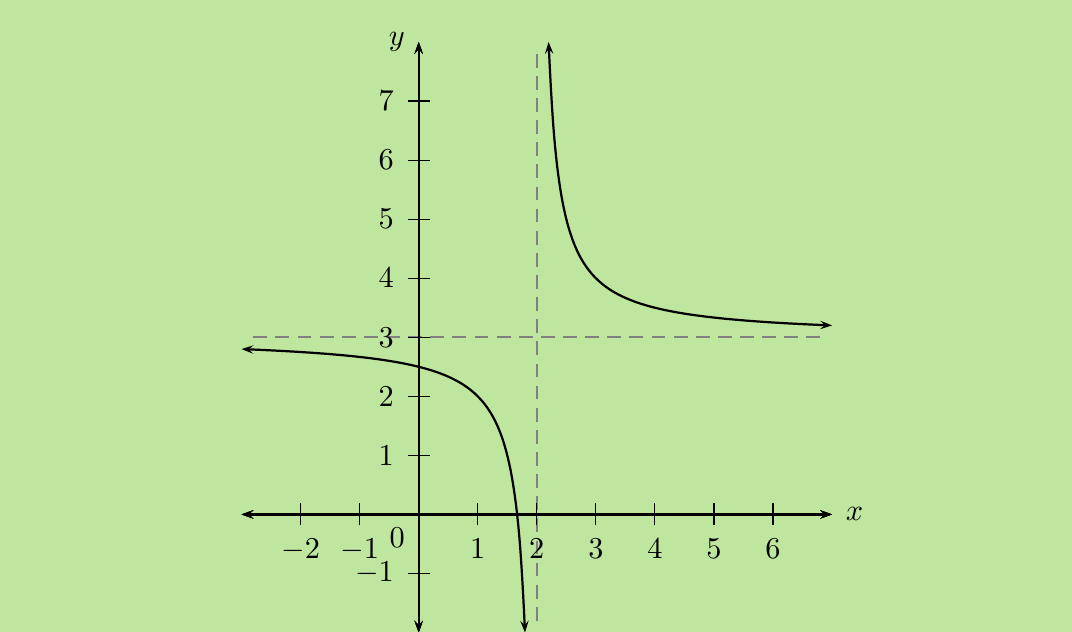
Question: Use horizontal and vertical shifts to sketch the graph of
Solution:
Step 1: Examine the equation
We notice that , therefore the graph will lie in the first and third quadrants.
Step 2: Sketch the standard hyperbola
Start with the standard hyperbola. The vertical asymptote is and the horizontal asymptote is .
Step 3: Determine the vertical shift
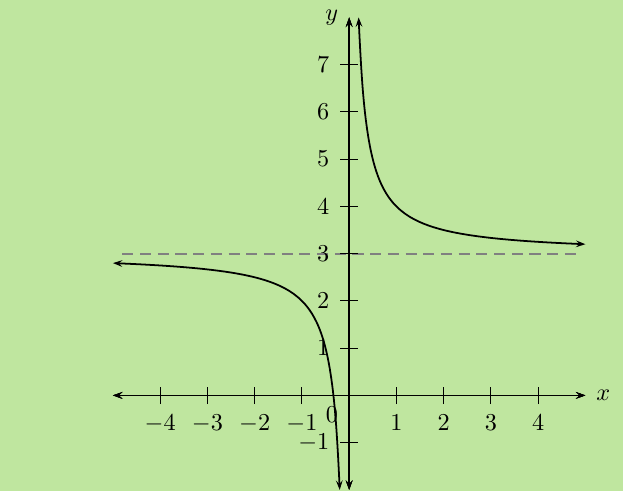
From the equation we see that , which means the graph shifts 3 units up. The horizontal asymptote shifts up to .
Step 4: Determine the horizontal shift
From the equation we see that , which means the graph shifts 2 units to the right. The vertical asymptote shifts right to .
Domain:
Range:
Finding equations from graphs
Sometimes you need to work backwards from a graph to determine the function's equation. This requires careful observation of the graph's key features.
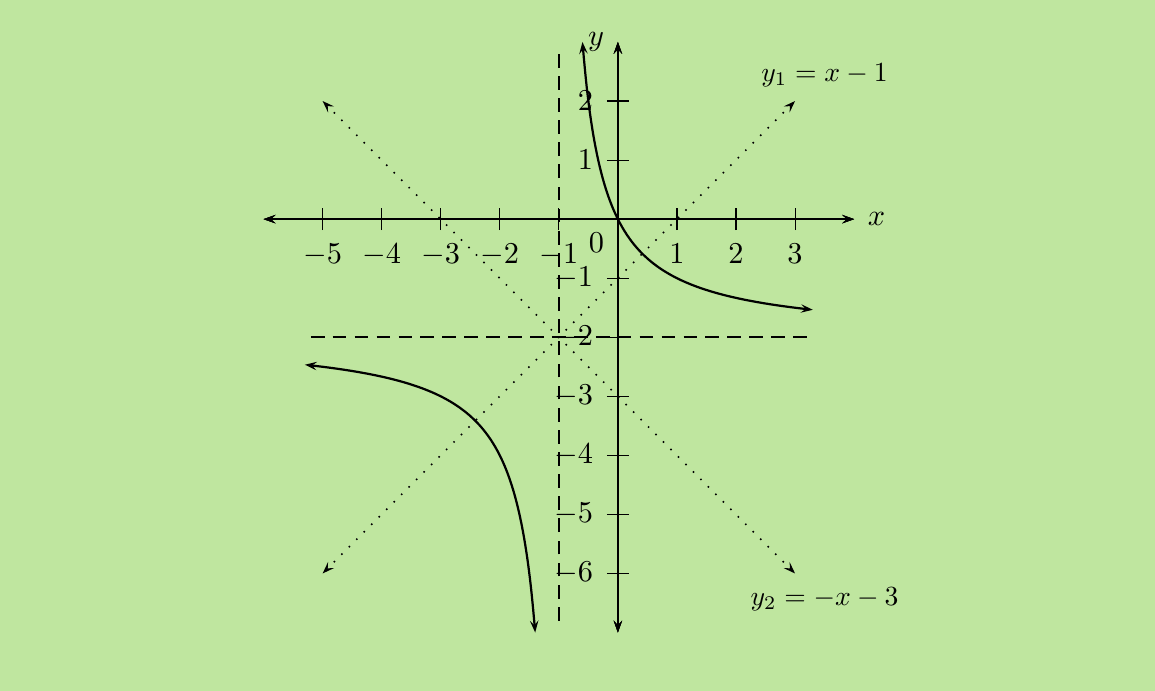
Worked Example 5: Finding Equation from Graph
Question: Use the graph below to determine the values of , and for
Solution:
Step 1: Examine the graph and deduce the sign of
We notice that the graph lies in the second and fourth quadrants, therefore .
Step 2: Determine the asymptotes
From the graph we see that the vertical asymptote is , therefore . The horizontal asymptote is , and therefore .
Step 3: Determine the value of
To determine the value of we substitute a point on the graph, namely :
Step 4: Write the final answer
Key Points to Remember:
-
Hyperbolic functions have the form where , , and are constants
-
Parameter effects: determines quadrants and shape, creates horizontal shifts, creates vertical shifts
-
Domain excludes values where the denominator equals zero:
-
Asymptotes are lines the graph approaches: horizontal asymptote , vertical asymptote
-
Intercepts are found by setting (y-intercept) or (x-intercept) and solving