The Tangent Function (Grade 11 NSC Matric Mathematics): Revision Notes
The Tangent Function
Basic tangent function
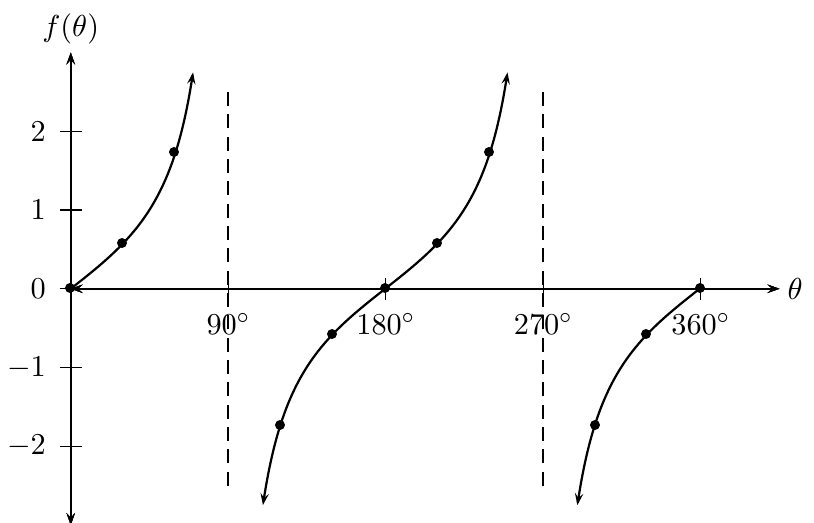
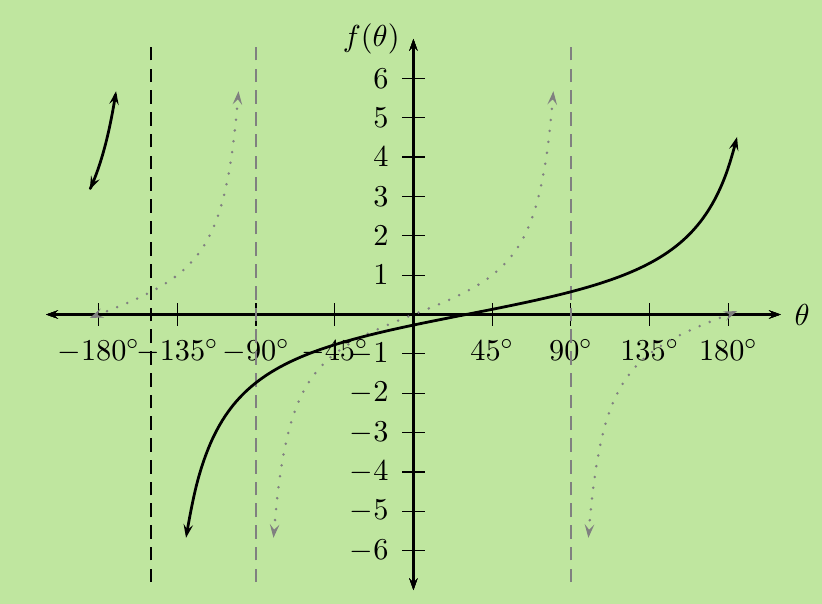
The tangent function is written as and has a unique shape that repeats every 180°. Unlike sine and cosine functions, the tangent function has vertical asymptotes where it becomes undefined.
The tangent function is fundamentally different from sine and cosine because it can take any real value and has vertical asymptotes where it becomes undefined. Understanding these asymptotes is essential for sketching tangent graphs accurately.
Key properties of y = tan θ
Critical Properties of the Basic Tangent Function:
-
Period: 180° - The tangent function completes one full cycle every 180°, making it different from sine and cosine which have periods of 360°.
-
Domain: - The function is undefined at where the asymptotes occur.
-
Range: - Unlike sine and cosine, tangent can take any real number value.
-
Asymptotes: Vertical lines at and (and every 180° thereafter) - These are the values where is undefined because .
-
x-intercepts: , , - The graph crosses the x-axis where .
-
y-intercept: - When , .
Transformations of the tangent function
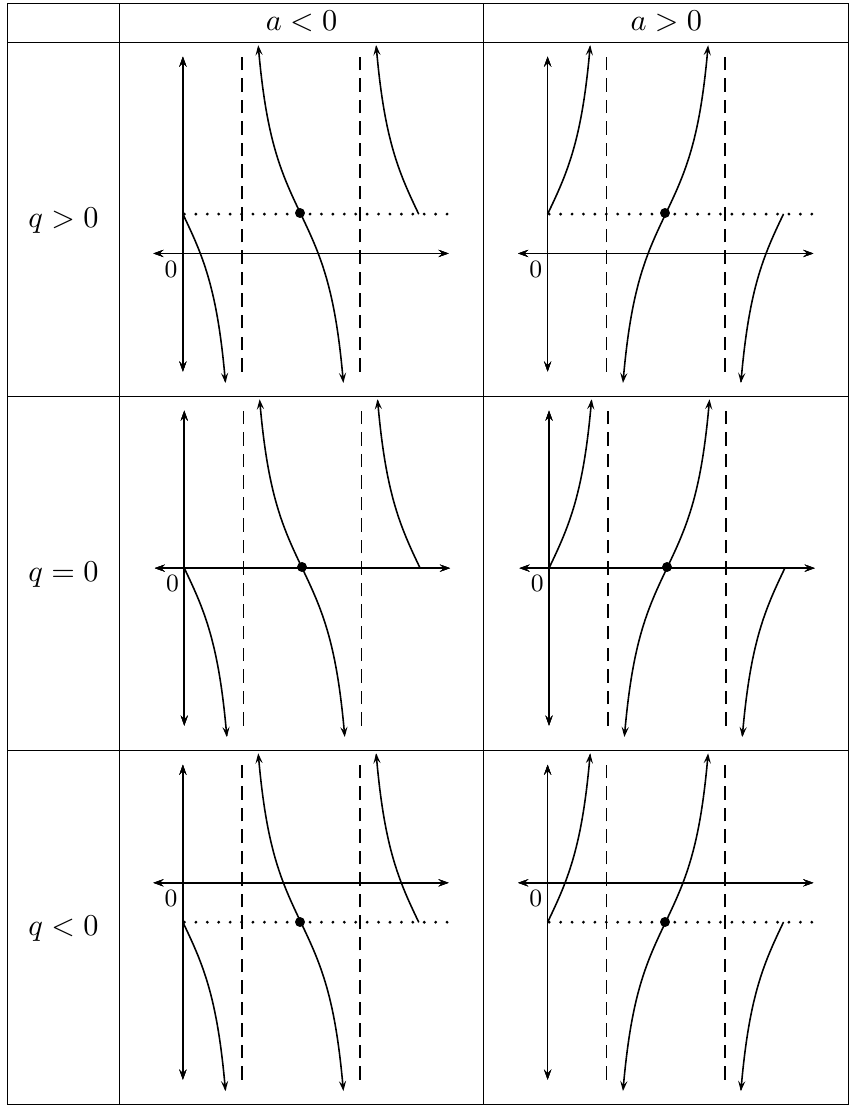
Functions of the form y = a tan θ + q
The general form involves two parameters that transform the basic tangent graph. Each parameter has a distinct effect on the graph's appearance.
Effect of parameter q (vertical shifts)
The parameter q creates vertical shifts of the entire tangent graph:
- For q > 0: The entire graph shifts vertically upwards by q units
- For q < 0: The entire graph shifts vertically downwards by |q| units
The y-intercept becomes instead of .
Effect of parameter a (shape and reflection)
The parameter a affects both the steepness and orientation of the tangent branches:
- For a > 1: The branches become steeper (graph stretches vertically)
- For 0 < a < 1: The branches become less steep (graph compresses vertically)
- For a < 0: The graph reflects about the x-axis
- For -1 < a < 0: Reflection about x-axis with less steep branches
- For a < -1: Reflection about x-axis with steeper branches
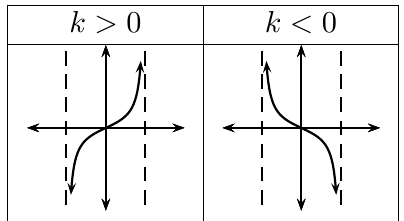
Functions of the form y = tan(kθ)
The parameter k affects the period of the tangent function and can cause reflections.
Period Formula for Transformed Tangent Functions:
For , the period is calculated as:
where |k| is the absolute value of k. This is the most important formula for determining how frequently the tangent function repeats.
Effect of parameter k
For k > 0:
- If k > 1: Period decreases (function repeats more frequently)
- If 0 < k < 1: Period increases (function repeats less frequently)
For k < 0:
- If -1 < k < 0: Graph reflects about the y-axis and period increases
- If k < -1: Graph reflects about the y-axis and period decreases
Important Property: Negative angles
This means tangent is an odd function, which explains why negative values of k cause reflections about the y-axis.
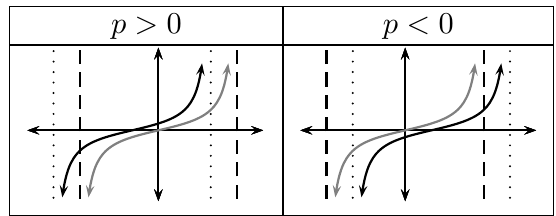
Functions of the form y = tan(θ + p)
The parameter p creates a horizontal shift (phase shift) of the tangent graph.
Effect of parameter p (horizontal shifts)
- For p > 0: The graph shifts horizontally to the left by p units
- For p < 0: The graph shifts horizontally to the right by |p| units
The y-intercept becomes instead of .
Sketching tangent graphs
Systematic Approach to Sketching Tangent Functions
Follow these steps in order to ensure accuracy and avoid common mistakes when sketching tangent graphs.
Step-by-step process
Step 1: Examine the equation form - Identify the values of parameters and predict the transformations.
Step 2: Determine the period - Use the period formula if k is present: Period = 180°/|k|
Step 3: Find the asymptotes - For basic tangent: For transformed tangent: Apply the transformations to these values.
Step 4: Create a table of values - Calculate key points including intercepts and points near asymptotes.
Step 5: Plot points and sketch - Draw the asymptotes as dashed lines, plot the calculated points, and connect with smooth curves.
Worked Example: Sketching y = tan(½(θ - 30°))
Step 1: From the equation, k = ½ and p = -30°
This means the period will be longer and the graph shifts right.
Step 2: Calculate the period
Period = 180°/|½| = 180°/0.5 = 360°
Step 3: Find asymptotes
Basic asymptotes at 90° and 270° become:
- ½(θ - 30°) = 90° → θ - 30° = 180° → θ = 210°
- ½(θ - 30°) = 270° → θ - 30° = 540° → θ = 570°
Since we're looking at -180° ≤ θ ≤ 180°, the asymptote at θ = -150° is relevant.
Step 4: The graph shows the completed sketch with:
-
Period: 360°
-
Domain: {θ : -180° ≤ θ ≤ 180°, θ ≠ -150°}
-
Range: (-∞; ∞)
-
y-intercept: (0°; -0.27)
-
x-intercept: (30°; 0)
-
Asymptote: θ = -150°
Worked examples
Example 1: Comparing y₁ = tan θ and y₂ = tan(3θ/2)
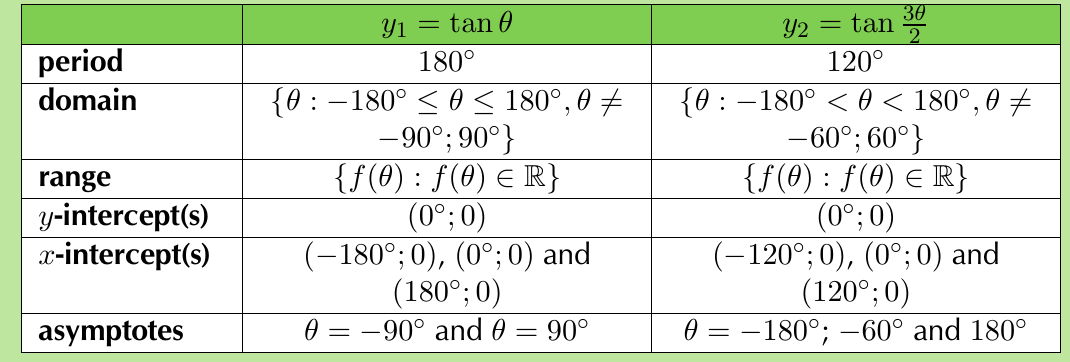
The table shows how the period changes from 180° to 120° when k = 3/2, demonstrating the period formula in action.
Example 2: Comparing y₁ = tan θ and y₂ = tan(θ + 30°)
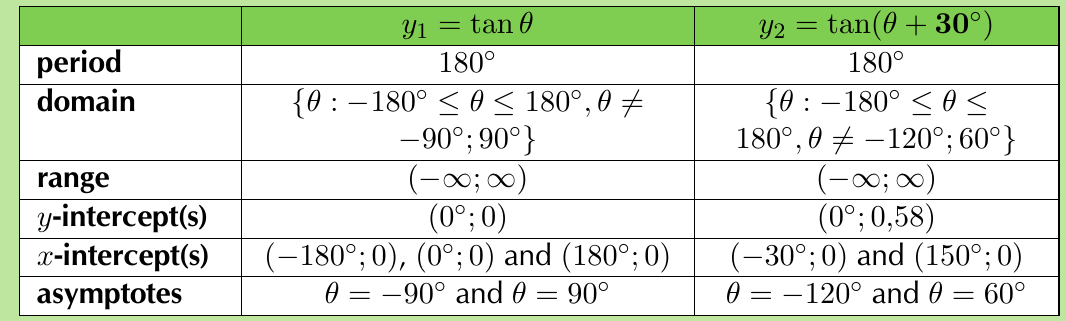
This example illustrates horizontal shifting, where adding 30° shifts all x-intercepts and asymptotes by 30° to the left.
Key Points to Remember:
- Asymptotes occur where tangent is undefined - always at odd multiples of 90°
- Period of basic tangent is 180°, but changes with parameter k using the formula 180°/|k|
- Vertical shifts (parameter q) move the entire graph up or down without changing asymptotes
- Horizontal shifts (parameter p) move asymptotes and intercepts left (p > 0) or right (p < 0)
- Parameter a affects steepness and can flip the graph when negative