Tree Diagrams (Grade 11 NSC Matric Mathematics): Revision Notes
Tree Diagrams
What are tree diagrams?
Tree diagrams are visual tools that help us organize and represent the different possible outcomes when we have a sequence of events. They look like upside-down trees with branches that split off to show all the ways events can unfold.
Think of tree diagrams as a map that shows every path you could take through a series of events. Each branch represents a possible outcome, and we write the probability of that outcome happening along the branch.
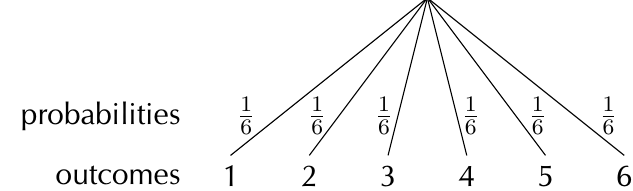
The diagram above shows a simple tree diagram for rolling a fair six-sided die. Notice how each outcome (1, 2, 3, 4, 5, 6) appears at the end of a branch, and each branch is labeled with the probability .
When should you use tree diagrams?
Tree diagrams are particularly useful when dealing with dependent events - situations where the outcome of one event affects the probability of the next event occurring.
However, tree diagrams are less helpful for independent events because we can simply multiply the individual probabilities together. For independent events, we use the formula:
Key Decision Rule: If you're unsure whether events are independent or dependent, or if you know they are dependent, use a tree diagram. If you're certain the events are independent, you can often solve the problem more quickly without drawing the tree.
Components of a tree diagram
Every tree diagram has these essential parts:
- Branches: Lines that represent possible outcomes
- Probabilities: Fractions or decimals written on each branch showing the likelihood of that outcome
- Outcomes: The final results written at the end of each complete path
- Levels: Each stage of events creates a new level in the tree
How to draw tree diagrams: step-by-step method
Step 1: Identify the events and their probabilities
Write down what can happen at each stage and determine the probability of each outcome.
Step 2: Draw the first level
Start with branches for all possible outcomes of the first event. Label each branch with its probability.
Step 3: Extend to subsequent levels
For each branch from the first level, draw new branches for the possible outcomes of the second event. Continue this pattern for all events.
Step 4: Label all outcomes
At the end of each complete path, write down what that path represents.
Calculating probabilities with tree diagrams
There are two key rules for calculating probabilities using tree diagrams:
- Multiplication rule: To find the probability of a specific path, multiply all the probabilities along that path
- Addition rule: To find the probability of an event that can occur in multiple ways, add the probabilities of all relevant paths
Worked example 1: Weather prediction
Worked Example: Weather Prediction Problem
Problem: If it rains today, there's a probability it will rain tomorrow. If it doesn't rain today, there's a probability it will rain tomorrow. The probability of rain today is . What's the probability it will rain the day after tomorrow?
Solution:
Step 1: Set up the first level The probability of rain today is , so the probability of no rain today is .
Step 2: Add the second level
- If it rains today: and
- If no rain today: and
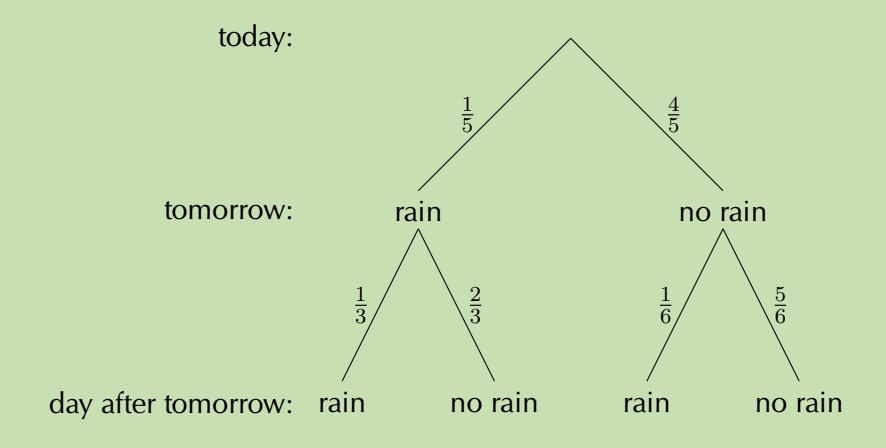
Step 3: Calculate the probability We want rain on the day after tomorrow, which can happen in two ways:
- Path 1: Rain today → Rain tomorrow → Rain day after tomorrow
- Path 2: No rain today → No rain tomorrow → Rain day after tomorrow
For Path 1:
For Path 2:
Total probability:
Worked example 2: Coin flipping game
Worked Example: Coin Flipping Game
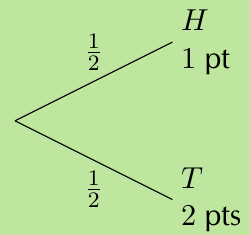
Problem: You flip a coin up to 3 times. If you get tails, you earn 2 points and stop. If you get heads, you earn 1 point and flip again. What's the probability of earning exactly 3 points?
Solution:
Step 1: Identify the events Each coin flip has probability for heads (H) and for tails (T).
- Heads = 1 point, continue flipping
- Tails = 2 points, game ends
Step 2: Draw the complete tree We can earn exactly 3 points in two ways:
- H, T (1 + 2 = 3 points)
- H, H, H (1 + 1 + 1 = 3 points)
Step 3: Calculate probabilities
Total probability:
Worked example 3: Medical trial
Worked Example: Medical Trial Analysis
Problem: In a medical trial, half the patients receive medicine and half receive a sugar pill. The medicine cures 60% of patients who take it, while only 10% of patients improve with the sugar pill. What's the probability that a randomly selected patient gets cured?
Solution:
Step 1: Identify the probabilities
- ,
- ,
- ,
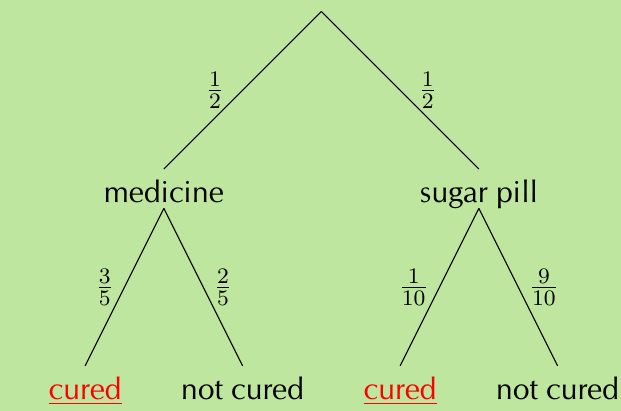
Step 2: Calculate using the tree diagram Two paths lead to being cured:
- Medicine path:
- Sugar pill path:
Step 3: Find total probability
Key exam tips
Essential Exam Strategies:
- Always check that probabilities on branches from the same point add up to 1
- Multiply along paths, add across outcomes - this is the golden rule
- Clearly label your tree diagram with probabilities and outcomes
- Show your working when calculating final probabilities
- Double-check your arithmetic - probability calculations often involve fractions
Common mistakes to avoid:
- Forgetting to multiply all probabilities along a path
- Adding probabilities instead of multiplying along paths
- Not considering all possible paths that lead to the desired outcome
- Mixing up conditional probabilities
Key Points to Remember:
- Tree diagrams visualize sequences of events by showing all possible paths and their probabilities
- Use tree diagrams for dependent events where one outcome affects the next, but they're less necessary for independent events
- Multiply probabilities along each path to find the probability of that specific sequence occurring
- Add probabilities across different paths when multiple sequences can lead to the same desired outcome
- All branch probabilities from any single point must sum to 1 - this helps you check your work
- Tree diagrams are powerful tools for conditional probability problems and are frequently tested in exams