Identification of Outliers (Grade 11 NSC Matric Mathematics): Revision Notes
Identification of Outliers
What are outliers?
An outlier is a data value that stands far apart from the rest of the values in a dataset. These unusual values can significantly affect statistical measures and need to be identified carefully during data analysis.
Outliers represent extreme measurements that don't follow the typical pattern of the dataset. Understanding them is crucial for accurate statistical analysis.
In statistical displays, outliers appear as data points that are isolated from the main cluster of values. They represent extreme measurements that don't follow the typical pattern of the dataset.
Identifying outliers using box plots
Box plots are particularly useful for spotting outliers because they clearly show the distribution of data. The box represents the middle 50% of the data (between the first and third quartiles), while the whiskers extend to show the minimum and maximum values within the normal range.
Key components of a box plot:
- Minimum value: The smallest data point
- First quartile (Q₁): The value below which 25% of data falls
- Median (Q₂): The middle value that divides the data in half
- Third quartile (Q₃): The value below which 75% of data falls
- Maximum value: The largest data point
Outliers typically appear as individual points beyond the whiskers of the box plot, indicating they are unusually far from the central distribution of data.
Worked example: Finding outliers with a box plot
Worked Example: Finding Outliers with Box Plot Data
Question: Find the outliers in this dataset by drawing a box plot: 0,5; 1; 1,1; 1,4; 2,4; 2,8; 3,5; 5,1; 5,2; 6; 6,5; 9,5
Solution:
Step 1: Calculate the five number summary
Since there are 12 values in the dataset:
- Minimum = 0,5
- Maximum = 9,5
- Median lies between the 6th and 7th values:
- Q₁ lies between the 3rd and 4th values:
- Q₃ lies between the 9th and 10th values:
Step 2: Draw the box plot
The box plot shows the five number summary with individual data points marked as dots below the plot.
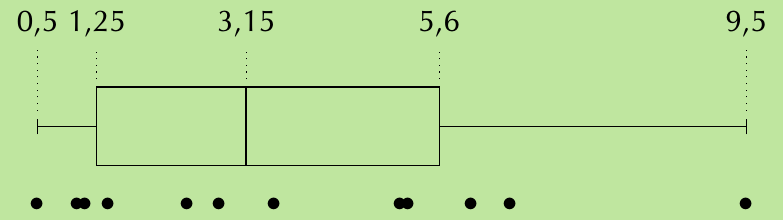
Step 3: Identify outliers
Looking at the box plot, most values cluster between 1 and 6. However, the maximum value of 9,5 stands far away from this main distribution. Therefore, 9,5 is the only outlier in this dataset.
Identifying outliers in scatter plots
A scatter plot displays the relationship between two variables by plotting data points on a coordinate system. This type of graph shows bivariate data (data with two variables).
When examining scatter plots for outliers, look for data points that:
- Are far removed from the main cluster of points
- Don't follow the general pattern or trend of the data
- Appear isolated from other measurements
Worked example: Outliers in scatter plots
Worked Example: Identifying Outliers in Scatter Plot Data
Question: A scatter plot shows height (horizontal axis) and weight (vertical axis) data for a group of people. Identify any outliers on the scatter plot.
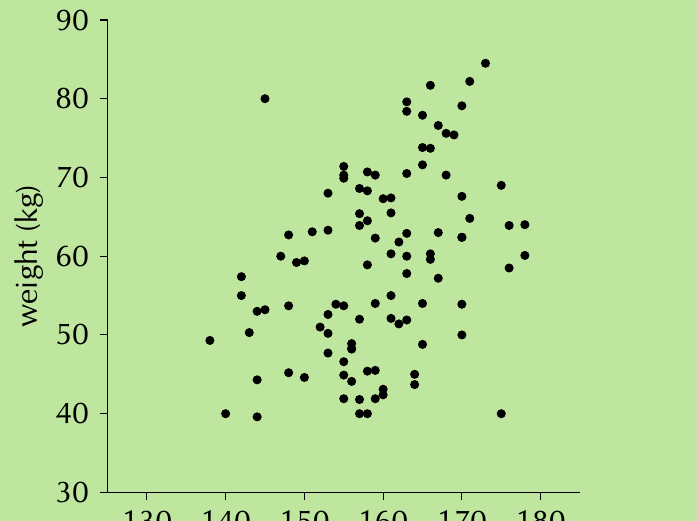
Solution:
By visually inspecting the scatter plot, we can identify the main distribution pattern. Most data points cluster together showing a positive correlation between height and weight.
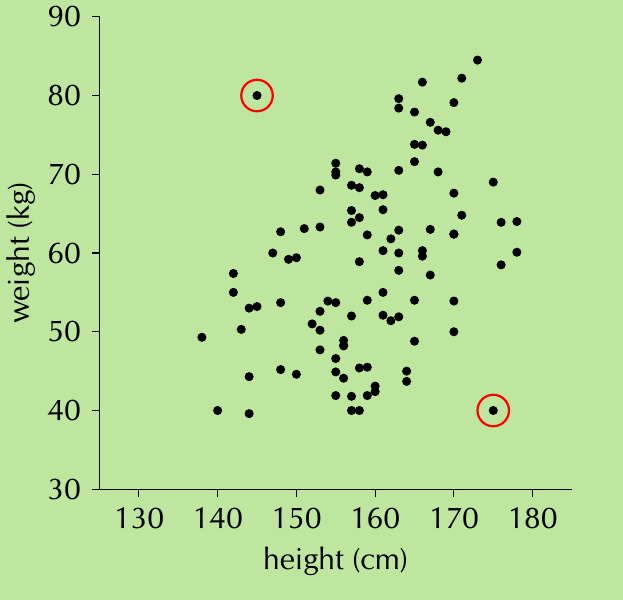
However, two points stand out as unusual:
- One point shows high weight (~80kg) with relatively low height (~145cm)
- Another point shows low weight (~40kg) with relatively high height (~175cm)
These two circled points are outliers because they don't follow the typical height-weight relationship shown by the majority of the data.
Exam tips
Essential Exam Strategies for Outlier Identification:
- Always examine scatter plots visually first to spot obvious outliers
- In box plots, outliers typically appear as separate dots beyond the whiskers
- Calculate the five number summary carefully, especially when finding quartile positions
- Remember that outliers can occur at both extremes (very high or very low values)
- For bivariate data, consider whether points fit the overall pattern, not just individual variable ranges
Remember!
Key Points to Remember:
- Outliers are data values that are far away from the rest of the dataset
- Box plots make outliers easy to spot as isolated points beyond the whiskers
- Calculate the five number summary systematically: minimum, Q₁, median, Q₃, maximum
- In scatter plots, look for points that don't follow the main pattern or cluster
- Visual inspection is often the first step in identifying outliers in any graph