Monopolies (Grade 12 NSC Matric Economics): Revision Notes
Monopolies

What is a monopoly?
A monopoly is a market structure where there is only one seller of a good or service for which no close substitute exists. This means consumers have no alternative choices when they want to purchase that particular product or service. The monopolist has complete control over the supply of the product in the market.
The key defining feature of a monopoly is the absence of competition and substitutes, which gives the single seller enormous market power to influence both prices and quantities in the market.
Characteristics of monopolies
Monopolies have several distinct features that set them apart from other market structures:
Single seller dominance: There is only one business selling the product in the entire market. This gives the monopolist significant power to control both price and quantity supplied.
Barriers to entry: New businesses cannot easily enter the market due to various obstacles. These barriers can include patents and intellectual property rights, government regulations, control over essential resources, or extremely high startup costs that prevent competitors from entering.
Price making ability: Unlike businesses in perfect competition who are price takers, monopolists are price makers. They can influence the market price by changing the quantity they supply to the market. This gives them considerable market power.
No close substitutes: The products offered by monopolies cannot be easily replaced by similar alternatives. Consumers have no choice regarding price and quality since there are no competing products available.
Absence of competition: Only one business controls the supply of goods and services in the market. This lack of competition means the monopolist faces no pressure from rivals.
Product differentiation: Monopolies often manufacture unique products that are difficult for other companies to copy or replicate. This uniqueness helps maintain their market position.
High capital requirements: Large amounts of starting capital are typically needed to enter these industries. For example, major South African companies like Eskom and SASOL required millions of rands in starting capital, making it difficult for new competitors to enter.
Legal protection: Many monopolies have legal considerations that protect their position. New inventions may be protected by patent rights, while some services like the Post Office are protected by law, preventing other businesses from entering the market.
Economic profit potential: Monopolists can make economic profit in the long run because they face no competition from new entrants, thanks to the barriers to entry that protect their market position.
Types of monopolies
Monopolies can be classified into two main groups based on the nature of barriers that prevent competition:
Natural monopolies occur when high development costs prevent other businesses from entering the market, so the government typically supplies the product. A prime example is electricity supply in South Africa, provided by the government enterprise Eskom. It costs billions of rands to build and maintain power stations, making it impractical for multiple suppliers to operate in this market.
Artificial monopolies exist where barriers to entry are not economic in nature but are created through legal means. A common example is patent protection. A patent gives a legal and exclusive right to manufacture a product. For instance, Denel Land Systems has exclusive rights to manufacture certain military equipment like Casspirs due to patent protection.
Understanding the distinction between natural and artificial monopolies is crucial for economic policy. Natural monopolies often require government intervention due to economic efficiency, while artificial monopolies are created through legal mechanisms like patents and regulations.
The demand curve of a monopolist
The demand situation faced by a monopolist is fundamentally different from that of businesses in perfect competition.
Under perfect competition, individual producers face a horizontal demand curve where demand equals marginal revenue equals average revenue (). This happens because these businesses are price takers who can sell any quantity at the prevailing market price.
In contrast, monopolists face a normal market demand curve that slopes downwards from left to right. For monopolies, demand equals average revenue (). This downward slope occurs because the monopolist is responsible for the entire output of the industry and must lower prices to sell additional units.
The marginal revenue curve of a monopolist
The marginal revenue curve of a monopolist behaves differently from that of perfectly competitive firms due to the downward-sloping demand curve.
The relationship between demand and marginal revenue is one of the most important concepts in understanding monopoly behaviour. This relationship directly affects how monopolists make pricing and output decisions.
When a monopolist faces a downward-sloping demand curve, its marginal revenue curve and demand curve are not the same, unlike in perfect competition. Under perfect competition, individual producers are price takers who can sell any quantity at the market price, so they face a horizontal demand curve that is also their marginal revenue curve.
For monopolists, the downward-sloping demand curve means that to increase sales by one additional unit, they must decrease the price of the product. This lower price applies to all customers, not just the additional customer. Therefore, the marginal revenue will be less than the price.
Consequently, the marginal revenue curve lies below the demand curve. This relationship is crucial for understanding monopoly pricing and output decisions.
Revenue analysis
Let's examine how revenue behaves in a monopoly using a practical example. The following data shows the relationship between price, quantity, and various revenue measures for a typical monopolist:
Worked Example: Monopoly Revenue Analysis
| Price | Quantity | Total Revenue | Average Revenue | Marginal Revenue |
|---|---|---|---|---|
| 100 | 0 | 0 | 0 | 0 |
| 100 | 1 | 100 | 100 | 100 |
| 90 | 2 | 180 | 90 | 80 |
| 80 | 3 | 240 | 80 | 60 |
| 70 | 4 | 280 | 70 | 40 |
| 60 | 5 | 300 | 60 | 20 |
| 50 | 6 | 300 | 50 | 0 |
| 40 | 7 | 280 | 40 | -20 |
| 30 | 8 | 240 | 30 | -40 |
Analysis of the patterns:
Step 1: Observe total revenue behaviour Total revenue initially increases, reaches a maximum of 300 when 5 or 6 units are sold, then decreases.
Step 2: Examine average revenue Average revenue equals the price at each quantity level, confirming that the demand curve is also the average revenue curve.
Step 3: Analyse marginal revenue Marginal revenue starts at 100, decreases with each additional unit, and eventually becomes negative after 6 units.
This data reveals several important patterns:
Total revenue initially increases as quantity increases, reaches a maximum of 300 when 5 or 6 units are sold, then begins to decrease. This happens because the price reductions needed to sell more units eventually outweigh the benefit of selling additional quantities.
Average revenue equals the price at each quantity level, confirming that the demand curve is also the average revenue curve.
Marginal revenue starts at 100 and decreases with each additional unit sold, eventually becoming negative. This demonstrates why the marginal revenue curve lies below the demand curve.
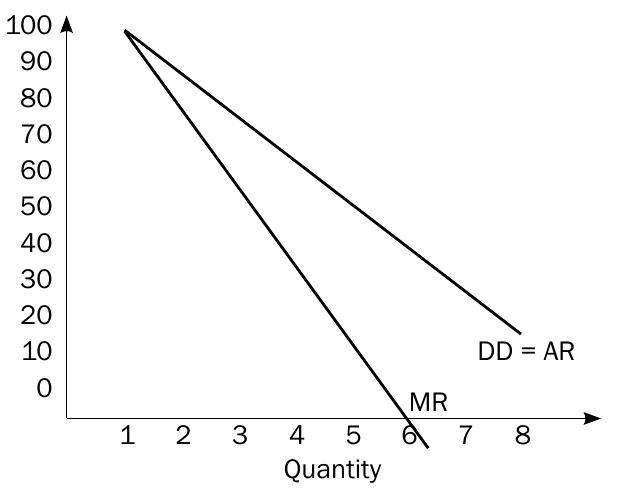
The graph above illustrates these relationships clearly. The demand curve (DD = AR) slopes downward from left to right, showing the inverse relationship between price and quantity demanded. The marginal revenue curve (MR) lies below the demand curve and declines more steeply, eventually crossing the horizontal axis and becoming negative.
Key Points to Remember:
-
A monopoly exists when there is only one seller with no close substitutes - this gives the monopolist significant market power
-
Monopolists are price makers, not price takers - they can influence market prices by controlling the quantity they supply
-
Barriers to entry protect monopolies - these can be natural (high costs) like Eskom's electricity infrastructure, or artificial (legal) like patent protection
-
The marginal revenue curve always lies below the demand curve- this is because monopolists must lower prices for all customers to sell additional units
-
Monopolies can earn long-run economic profits - unlike perfect competition, barriers to entry prevent new competitors from eliminating these profits