Vertical Exaggeration (Grade 12 NSC Matric Geography): Revision Notes
Vertical Exaggeration
Understanding cross sections and the need for vertical exaggeration
In mapwork, we create cross sections to better understand what a landform looks like from the side. A cross section is essentially like 'cutting through' a landscape to see its profile, similar to how you might cut through a cake to see the layers inside.
Think of a cross section like slicing through a layered cake - you can see all the different layers and their thicknesses from the side view, just like we can see the elevation changes in a landscape.
To create a cross section, we use contour lines from topographic maps. These brown lines show us the height of different parts of the landscape, and by following them, we can trace the ups and downs of the terrain.
When we draw a cross section on a graph, we use the vertical axis to show height and the horizontal axis to show distance. However, there's often a problem when both the vertical and horizontal scales are the same.
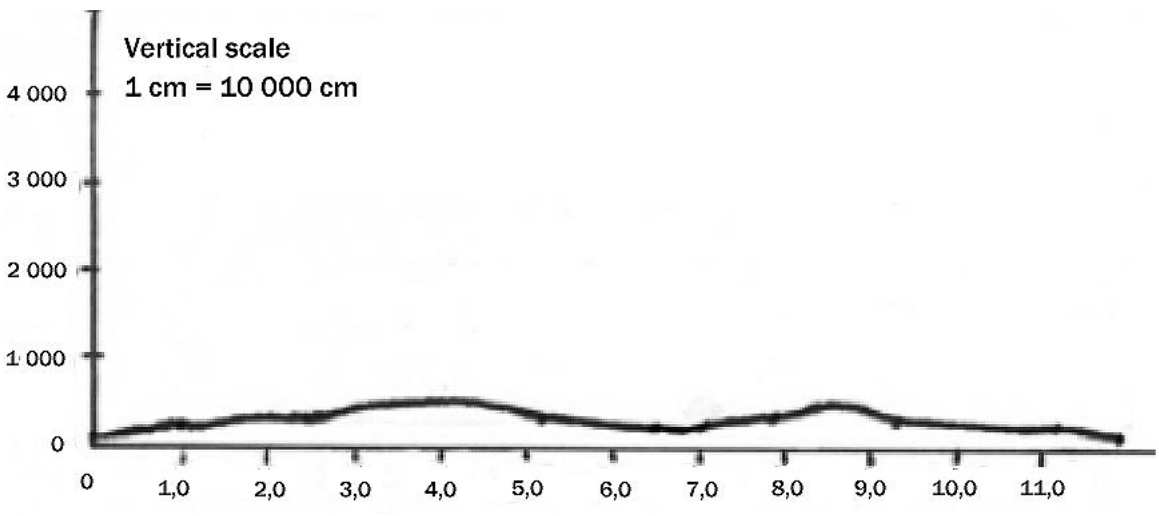
If the vertical and horizontal scales are identical (like 1:10 000 for both), it becomes very difficult to see the differences in slope and elevation clearly. The landscape appears almost flat, even when there are significant hills and valleys.
Why do we need vertical exaggeration?
To overcome this problem, we make the profile more obvious by using a different vertical scale from the horizontal scale. This technique is called vertical exaggeration.
By using a larger vertical scale (where 1 cm might represent 20 m instead of 100 m), the changes in slope and elevation become much clearer and easier to analyse.
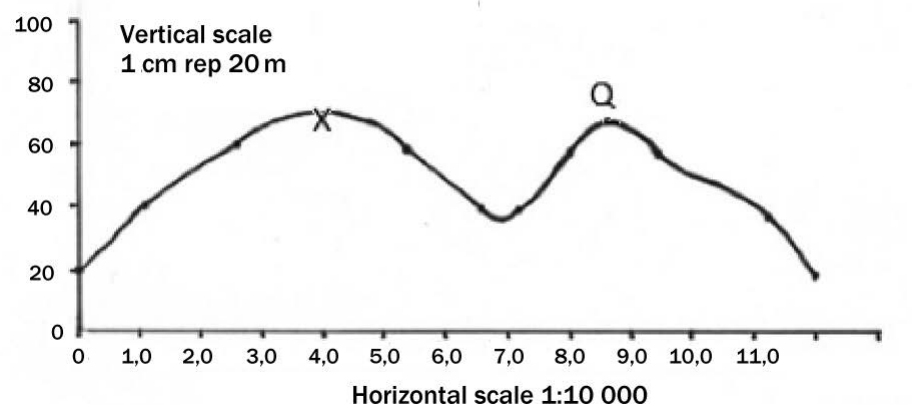
When we create this type of cross section, we say it has been exaggerated, and we need to calculate exactly how many times steeper it has been made. This calculation is called the vertical exaggeration.
The formula for vertical exaggeration
The formula for calculating vertical exaggeration is:
This can be written as:
Step-by-step method for calculating vertical exaggeration
Here's a systematic approach to calculating vertical exaggeration:
Step 1: Convert the vertical scale from words to numbers
- If given "1 cm = 40 m", you need matching units on both sides
- Convert 40 m to cm: cm
- So the scale becomes 1 cm = 4000 cm, or 1:4000
Step 2: Identify the horizontal scale
- This is usually already given as a number scale (e.g., 1:50 000 for topographic maps, 1:10 000 for orthophotos)
Step 3: Write both scales as fractions and divide
Step 4: 'Flip and multiply' the fractions
- Swap the numerator and denominator of the horizontal scale fraction
Step 5: Calculate the final answer
- Use your calculator:
Step 6: Write your final answer
- VE = 12.5 times
- This means the cross section has been exaggerated 12.5 times to make landscape changes more visible
Memory tip: Remember that the horizontal scale goes on top in the division because 'H' comes before 'V' in the alphabet!
Worked examples
Worked Example 1: Topographic map
Given information:
- Vertical scale: 1 cm = 50 m
- Horizontal scale: 1:50 000
Step 1: Convert vertical scale
- 1 cm = 50 × 100 = 5000 cm
- VS = 1:5000
Step 2: Apply the formula
Answer: VE = 10 times
Worked Example 2: Orthophoto
Given information:
- Vertical scale: 1 cm = 25 m
- Horizontal scale: 1:10 000
Step 1: Convert vertical scale
- 1 cm = 25 × 100 = 2500 cm
- VS = 1:2500
Step 2: Apply the formula
Answer: VE = 4 times
Summary
Key Points to Remember:
-
Vertical exaggeration makes landscape features more visible by using different vertical and horizontal scales
-
Always write the formula - this earns you marks in exams
-
Convert vertical scales to the same units before calculating (metres to centimetres)
-
The horizontal scale goes on top because 'H' comes before 'V' in the alphabet
-
Vertical exaggeration shows how many times steeper the cross section has been made compared to reality