Mapwork (Grade 12 NSC Matric Geography): Revision Notes
Mapwork
Understanding direction and compass points
Direction on maps is shown using compass points, which help you navigate and describe locations accurately. The compass system uses 16 cardinal points that divide the circle into precise directional segments.
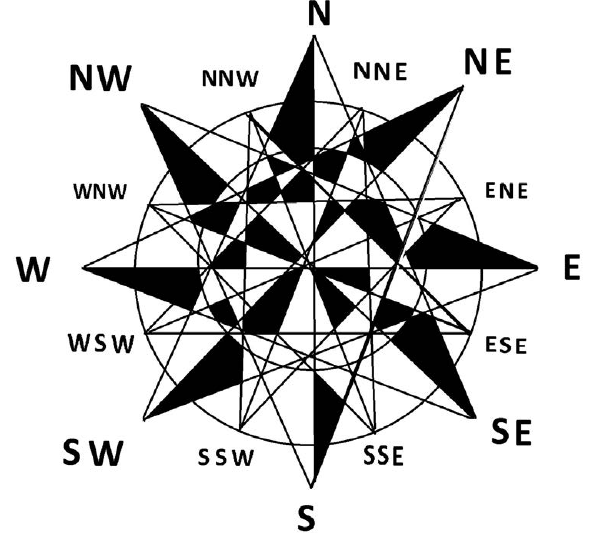
These 16 cardinal points include the four main directions (North, South, East, West) plus twelve additional points that fall between them. This system allows for much more precise directional descriptions than just using the basic four directions.
To remember the order of the main compass points as you move clockwise, use this helpful memory trick that appears in the image below. The phrase "Never Eat Silk Worms" corresponds to North, East, South, West in clockwise order.
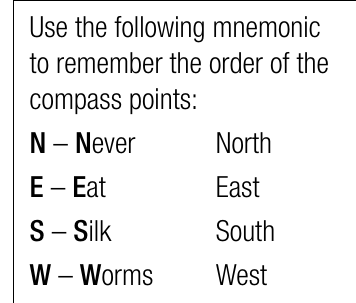
This simple mnemonic will help you quickly recall the correct sequence during exams and practical mapwork exercises.
Lines of latitude and global positioning
Three major lines of latitude circle our planet and are crucial for understanding global geography and climate patterns. These lines help divide the Earth into different climate zones and are essential reference points for mapwork.
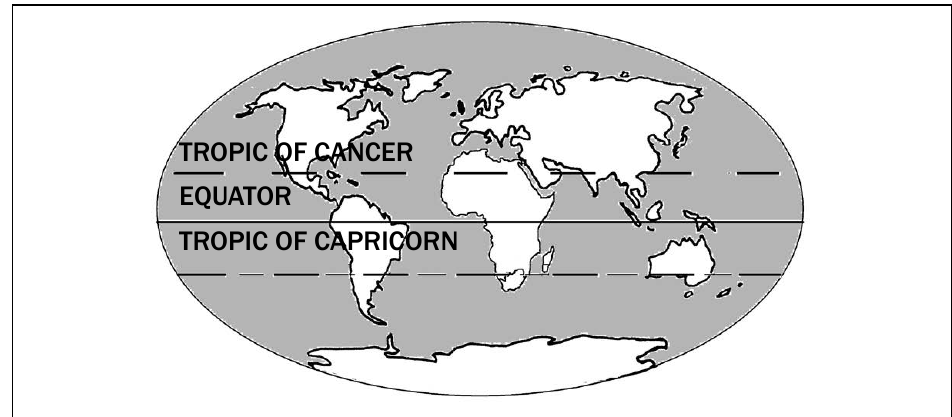
The equator sits at latitude and represents the longest line of latitude around Earth. This is where our planet is widest when measured from east to west. The equator acts as the dividing line between the northern and southern hemispheres.
The Tropic of Cancer runs at north of the equator, while the Tropic of Capricorn sits at south of the equator. These lines mark the boundaries of the tropical climate zone.
For South African students, it's particularly important to note that the Tropic of Capricorn passes through the northern parts of our country. This means South Africa spans both tropical and subtropical climate zones.
These latitude lines are fundamental for understanding seasonal patterns, climate zones, and the position of places on Earth's surface.
Map symbols and conventional signs
Maps use a standardised system of symbols called conventional signs to represent different landscape features. These symbols help you identify everything from natural features to human-made structures without cluttering the map with lengthy descriptions.
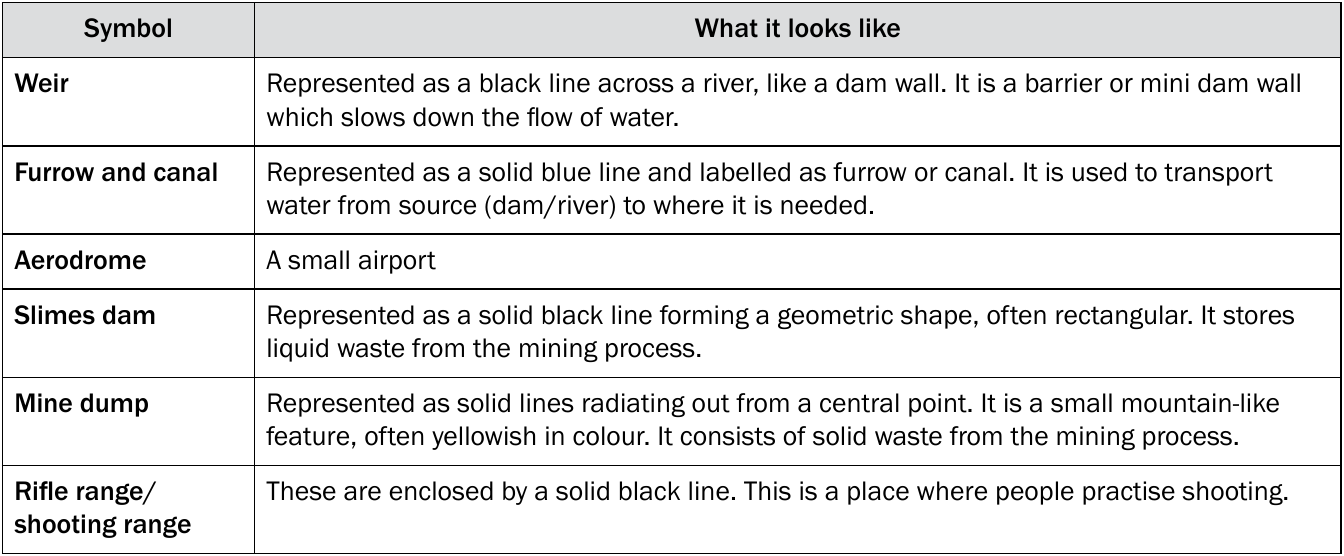
Understanding these symbols is essential for reading maps effectively. Many symbols are designed to look similar to what they represent in real life, making them easier to remember. For example, a weir appears as a black line across a river because it acts like a barrier, whilst mine dumps show radiating lines because the waste material spreads outward from a central point.
When studying maps, always check if there's a legend or key that explains the specific symbols used, as these can vary slightly between different map publishers. This habit will save you time and prevent misinterpretation during exams.
Map colour system
Maps use a systematic colour scheme to help you quickly identify different types of features across the landscape. Understanding this colour coding is crucial for rapid map interpretation during exams.
Each colour group represents specific categories of features:
Brown indicates natural earth features like contour lines, rocky outcrops, sand dunes, and secondary roads. This colour helps you understand the terrain and elevation changes.
Blue shows all water-related features including rivers, lakes, dams, marshes, and coastlines. Surprisingly, major national freeways also appear in dark blue.
Green represents vegetation and agricultural areas such as cultivated fields, forests, golf courses, and nature reserves.
Black covers constructed features like roads, railways, buildings, bridges, power lines, and various boundaries.
Grey specifically indicates built-up urban areas where development is concentrated.
Red highlights major transportation routes like national and arterial roads, plus important navigation aids such as lighthouses, with pink used for international boundaries.
Map Colour Reference:
- Brown: Earth features, contour lines, secondary roads
- Blue: Water features, major freeways
- Green: Vegetation, agriculture, parks
- Black: Buildings, roads, railways, boundaries
- Grey: Urban areas
- Red: Major roads, lighthouses, boundaries
Contour lines and relief
Contour lines are one of the most important features on topographic maps as they show the three-dimensional shape of the land on a flat surface. These lines connect points of equal elevation and help you understand the steepness and shape of terrain.
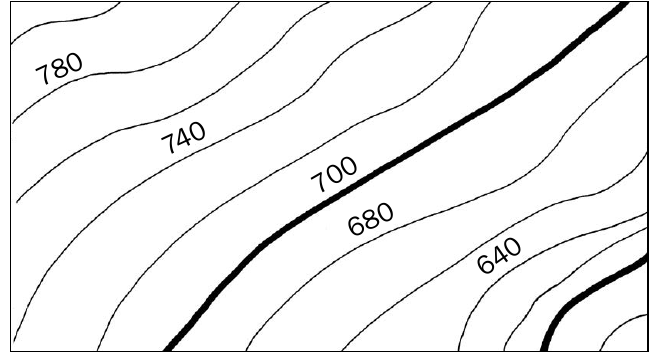
When contour lines are close together, this indicates steep slopes where elevation changes rapidly over a short horizontal distance. The terrain rises or falls quickly in these areas.
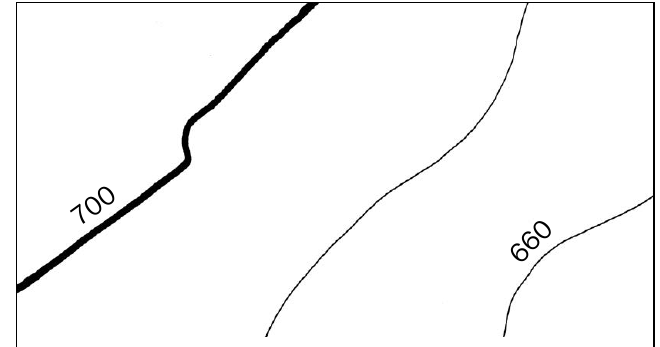
Conversely, when contour lines are spaced far apart, this shows gentle slopes where elevation changes gradually. These areas have more gradual inclines that are easier to traverse.
The numbers on contour lines indicate the height above sea level in metres. By following these lines, you can trace paths of equal elevation around hills and valleys. The pattern of contour lines also reveals landscape features like ridges, valleys, peaks, and saddles.
Key Rule: Contour lines never cross each other, as a single point cannot have two different elevations simultaneously. If you see lines crossing on a map, it indicates an error or special feature like an overpass.
Reading Contour Lines Example:
If you see contour lines marked 100m, 120m, 140m, and 160m that are very close together, this tells you:
- The area rises 60m in elevation (from 100m to 160m)
- The slope is steep because the lines are close
- You would find this terrain challenging to climb
Key Points to Remember:
- Use "Never Eat Silk Worms" to remember the clockwise order of main compass directions: North, East, South, West
- The three major latitude lines are the Equator (), Tropic of Cancer (), and Tropic of Capricorn ()
- Map colours follow a logical system: brown for earth features, blue for water, green for vegetation, black for construction, grey for urban areas, and red for major roads
- Close contour lines indicate steep slopes, while widely spaced lines show gentle gradients
- Always check the map legend to understand the specific symbols and scale used