Correlation (Grade 12 NSC Matric Mathematics): Revision Notes
Correlation
What is correlation?
Correlation is a statistical measure that helps us understand the relationship between two variables. The linear correlation coefficient, represented by the symbol r, tells us both the strength and direction of this relationship.
Understanding correlation is essential for analysing data patterns and making predictions based on relationships between variables. In statistics, correlation provides a quantitative way to measure how two variables move together, which is fundamental to data analysis across many fields.
The correlation coefficient always falls between -1 and +1, written as . This range gives us important information:
- When , there is perfect negative correlation
- When , there is no correlation
- When , there is perfect positive correlation
Types and strengths of correlation
Correlation can be positive or negative, and each type can vary in strength from very weak to very strong. The direction and strength of correlation help us understand not just whether variables are related, but how strongly they are connected.
Positive correlation
When one variable increases, the other variable also increases. The data points on a scatter plot slope upwards from left to right.
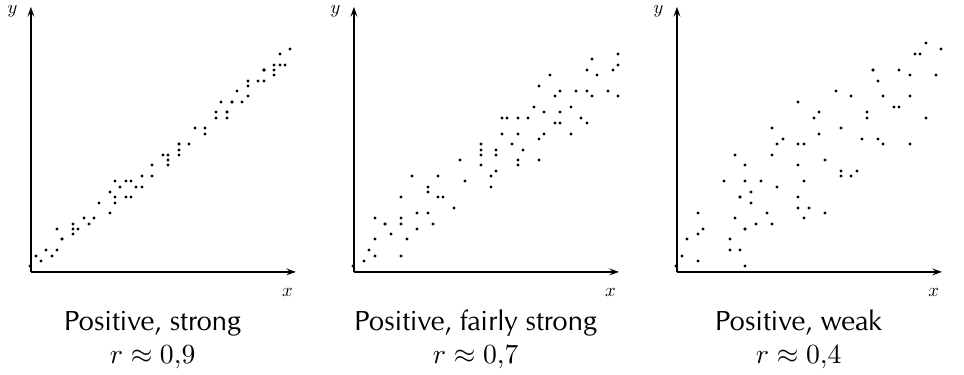
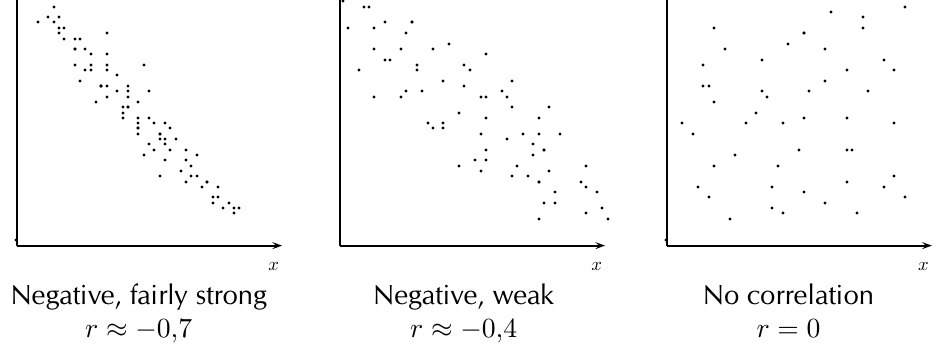
Negative correlation
When one variable increases, the other variable decreases. The data points on a scatter plot slope downwards from left to right.
Interpreting correlation strength
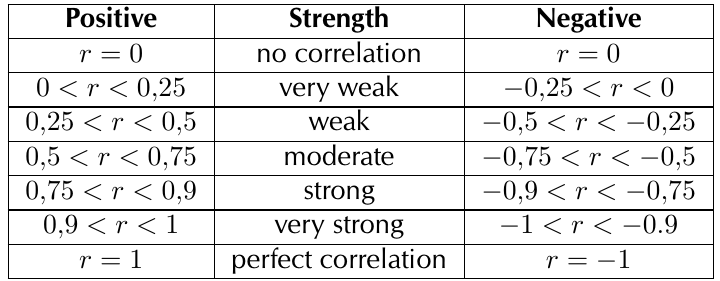
The following table shows how to interpret different correlation coefficient values:
Understanding these strength categories is crucial for proper interpretation of statistical relationships:
Key strength categories:
- : No correlation
- : Very weak correlation
- : Weak correlation
- : Moderate correlation
- : Strong correlation
- : Very strong correlation
- : Perfect correlation
Correlation coefficient formula
The correlation coefficient provides a standardised measure of the linear relationship between variables. This standardisation allows us to compare correlations across different datasets and contexts.
The correlation coefficient can be calculated using the formula:
Where:
- is the gradient of the least squares regression line
- is the standard deviation of the x-values
- is the standard deviation of the y-values
This is known as Pearson's product moment correlation coefficient. The standard deviation formula is:
While this formula shows the mathematical relationship between correlation and regression, it's much easier to use a calculator for this calculation. However, understanding the components helps you interpret the result and understand why correlation and regression are closely related.
Important notes about correlation
Understanding the limitations and proper interpretation of correlation is crucial for avoiding common statistical mistakes. One of the most significant misconceptions in statistics involves the relationship between correlation and causation.
Correlation does NOT imply causation!
This is one of the most important concepts to remember. Just because two variables are correlated does not mean that one causes the other. Always look for underlying factors that might explain why two variables appear related before assuming one causes the other.
Example: Ice Cream and Shark Attacks
Ice cream sales and shark attacks are correlated. This does not mean that selling ice cream causes shark attacks! Instead, both increase during warmer weather when more people visit beaches. The underlying factor (warm weather) explains the correlation between these seemingly unrelated variables.
Worked example: heart rate correlation
Worked Example: Analysing Heart Rate Correlation
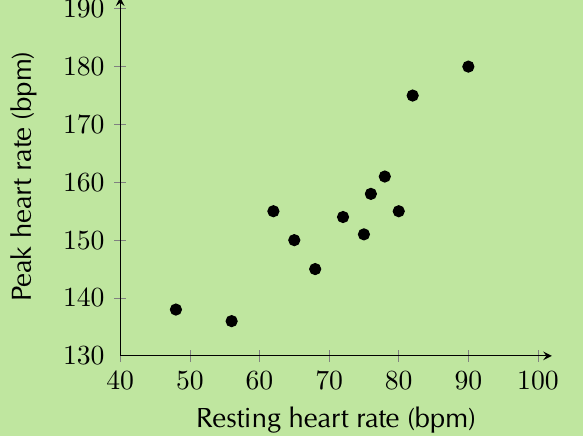
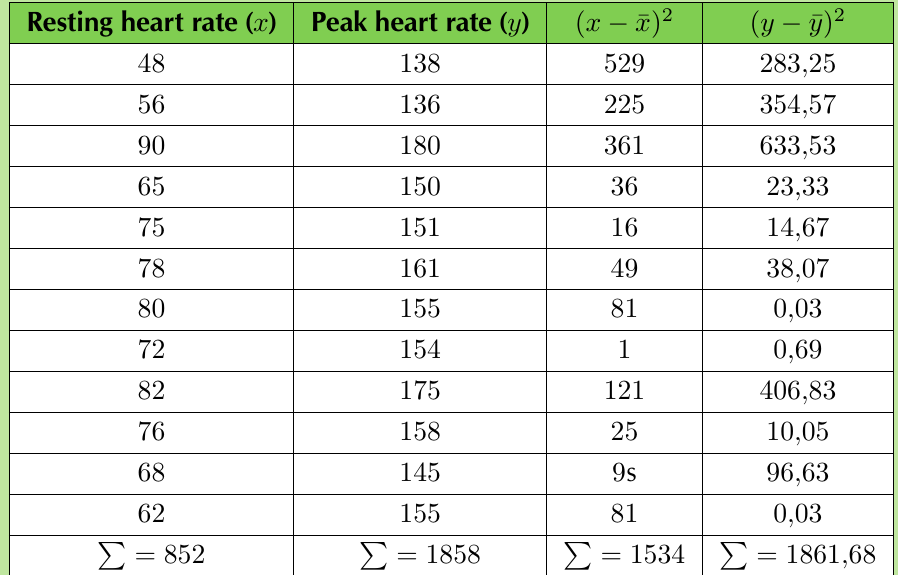
Problem: A cardiologist wants to test the relationship between resting heart rate and peak heart rate during exercise. Here is the data from 12 study participants:

Step 1: Create a scatter plot
Plot the data with resting heart rate on the x-axis and peak heart rate on the y-axis.
Step 2: Calculate the equation of the line of best fit
Using a calculator:
Therefore, the equation is:
Step 3: Make predictions
For a resting heart rate of 70 bpm: bpm
Step 4: Calculate the correlation coefficient
First, calculate the means and complete the calculation table:
Using the standard deviation formula:
Therefore:
Step 5: Interpret the result
indicates a strong, positive, linear relationship between resting heart rate and peak heart rate. This means that people with higher resting heart rates tend to have higher peak heart rates during exercise.
Calculator shortcuts
Modern calculators can compute correlation coefficients directly, saving significant time during calculations and reducing the chance of computational errors.
Calculator Methods:
Once you've entered your data into your calculator in STAT mode:
For SHARP calculators: Press [RCL] then [r] (same key as [÷])
For CASIO calculators: Press [SHIFT] then [STAT], [5], [3] then [=]
This gives you the correlation coefficient directly without manual calculation.
Exam tips
When working with correlation problems in exams, systematic approach and clear communication are essential for full marks.
Key Exam Strategy Points:
- Always comment on both the strength and direction of correlation
- Use the correlation table to classify strength accurately
- Remember that correlation measures linear relationships only
- Always mention that correlation does not imply causation when relevant
- Check your calculator result makes sense with your scatter plot
- Show all working steps clearly
- Include units in your final interpretation
Remember!
Key Points to Remember:
-
Correlation coefficient () measures the strength and direction of a linear relationship between two variables, where
-
Positive correlation means both variables increase together, while negative correlation means one increases as the other decreases
-
Strong correlations have values close to 1, while weak correlations have values close to 0
-
Correlation does NOT equal causation - just because variables are related doesn't mean one causes the other
-
Use your calculator to find correlation coefficients quickly, but always interpret the result in context