Instrumental Quantitative Techniques (HSC SSCE Chemistry): Revision Notes
Instrumental Quantitative Techniques
Introduction to instrumental techniques
Instrumental techniques have become increasingly common in chemical analysis, particularly when analysing substances present in very low concentrations. Traditional methods like precipitation titrations and gravimetric analysis work well for samples with concentrations greater than mg. However, instrumental techniques are more sensitive and can detect concentrations below ppm (parts per million).
The sensitivity advantage of instrumental techniques makes them essential for modern chemical analysis, especially in environmental monitoring, forensics, and health applications where trace amounts of substances need to be detected and measured accurately.
This section covers two important instrumental techniques used in inorganic analysis:
- Atomic absorption spectroscopy (AAS)
- Colourimetry
Both techniques are valuable for quantitative analysis, meaning they help determine the amount of a substance present in a sample.
Atomic absorption spectroscopy
What is atomic absorption spectroscopy?
Atomic absorption spectroscopy (AAS) is an instrumental technique used to perform quantitative analysis by determining how much of a specific element is present in a sample. The method works by measuring how much light is absorbed by electrons within atoms of the element being tested.
Why is AAS important?
AAS is particularly valuable for detecting metal ions, especially those that are toxic to humans. Certain metals, known as heavy metals (because they have high atomic masses), can cause serious health problems when present in large amounts.
Heavy metals of particular concern include:
- Mercury (Hg)
- Lead (Pb)
- Aluminium (Al)
- Arsenic (As)
- Cadmium (Cd)
These elements are found in small quantities in humans due to everyday exposure through materials and the environment. For instance, lead was historically used in paints and fuels, whilst aluminium can enter the body through deodorants, drinking water, medications, and processed foods.

Health impacts of heavy metal exposure:
- Lead exposure can cause severe illness, DNA damage, and death
- Aluminium accumulation can lead to osteoporosis, headaches, and liver/kidney problems
AAS can detect low concentrations of these metal ions, allowing potential health hazards to be identified early.
How atomic absorption spectroscopy works
The AAS process uses an atomic absorption spectrometer. Here's how it works:
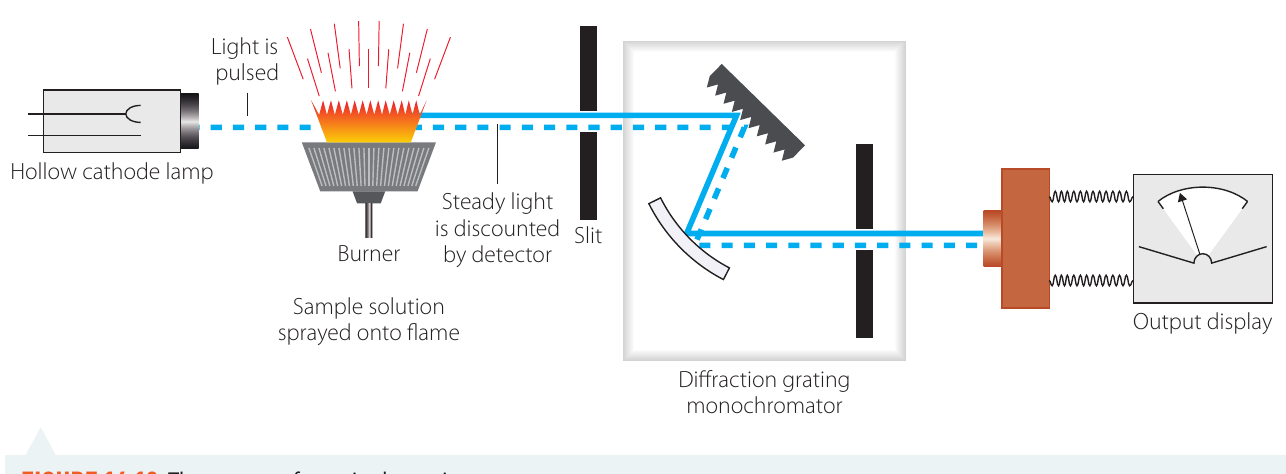
Step 1: Select the element-specific lamp
First, you need to identify which element you're testing for. This is crucial because samples (like food, paint, or soil) contain multiple elements. Using normal white light would be useless—all elements would absorb some light.
The lamp used in AAS is made from the same element being tested. For example:
- Testing for zinc? Use a zinc lamp
- Testing for mercury? Use a mercury lamp
When an electric current passes through the gaseous element in the lamp, it emits light with wavelengths specific to that element only.
Step 2: Vaporise the sample
The sample being tested is vaporised, which means it's converted from its normal state into individual atoms in gaseous form.
Step 3: Light absorption
When light from the element-specific lamp passes through the vaporised sample, only the element being tested will absorb the light. This happens because:
- The target element has the same energy levels as the atoms that emitted the light
- Other elements in the sample have different energy levels and cannot absorb these specific wavelengths
Step 4: Isolate and measure
After passing through the sample, the light travels through a slit and enters a monochromator (a device containing a diffraction grating). This selects just one wavelength of light for analysis.
A detector then measures the intensity of the light that passed through without being absorbed. This measurement gives an absorbance value.
Understanding absorbance values:
The absorbance value is not the concentration itself. However, it's related to concentration:
- Higher concentration → more light absorbed → less light reaches detector → lower absorbance value
- Lower concentration → less light absorbed → more light reaches detector → higher absorbance value
Quantitative analysis using AAS
To determine the actual concentration of an element in an unknown sample, you need to construct a calibration curve. Here's the process:
- Prepare several samples with known concentrations of the element
- Measure the absorbance value for each known sample using AAS
- Plot a graph with concentration on the horizontal axis and absorbance on the vertical axis
- Draw a line of best fit through the points—this is your calibration curve
- Measure the absorbance of your unknown sample
- Use the calibration curve to find the corresponding concentration
Worked Example: Determining mercury concentration in fish
To find the concentration of mercury in a fish sample, absorbances of mercury samples with known concentrations were measured:
| Mercury concentration (ppm) | Absorbance |
|---|---|
The fish sample gave an absorbance value of .
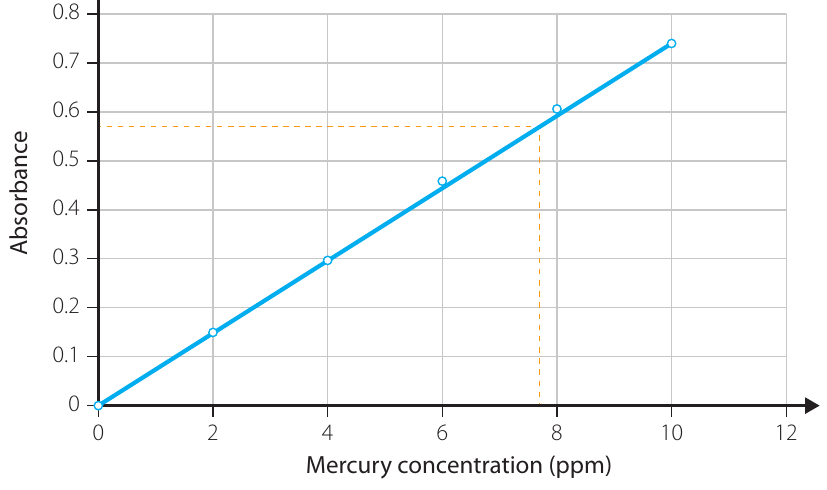
Solution steps:
- Plot the known concentration and absorbance data
- Draw a line of best fit
- Find on the absorbance axis
- Draw a horizontal line to the calibration curve
- Draw a vertical line down to the concentration axis
- Read the concentration value
Answer: The concentration of mercury in the fish sample is ppm.
This method of reading values from a graph is called interpolation.
Colourimetry
What is colourimetry?
Colourimetry is a method for determining the concentration of a chemical in solution by measuring its colour intensity. The technique is based on a simple principle: the intensity of colour is directly proportional to concentration—the higher the concentration, the more intense the colour.
Colourimetry can be thought of as a simpler version of UV-visible spectrophotometry. Whilst UV-visible spectrophotometry measures radiation absorbed across a range of frequencies, colourimetry focuses on a single frequency, usually in the visible spectrum.
Applications of colourimetry
Colourimetry is widely used across various fields:
- Food and beverage industry: Quality control of products
- Agriculture: Analysis of fertilisers for manganese and iron(III) content
- Environmental monitoring: Measuring contaminants in soil and water
- Forensics: Detecting toxic metal ions (lead, cadmium, chromium) in various samples, including urine
The technique can be used to find the concentration of any coloured species in solution.
How colourimetry works
A colourimeter is the instrument used to measure light absorption by coloured solutions. The process is similar to AAS:
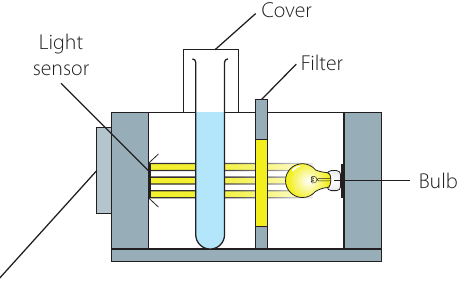
Components and process:
- Light source: A bulb produces white light
- Filter: The light passes through a coloured filter that produces a specific wavelength
- Sample container: The solution is placed in a special glass cuvet (a type of test tube)
- Light absorption: The filtered light passes through the solution, and some is absorbed
- Detector: A light sensor measures the amount of light that passes through
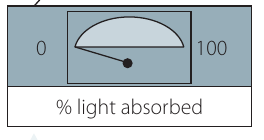
- Display: The absorbance is shown as a reading
Calibration:
Before measuring samples, the instrument must be calibrated using a blank—a cuvet containing only distilled water. This sets the instrument to read zero absorbance for pure water.
The complementary colour principle
An important aspect of colourimetry is selecting the correct filter. You must use the complementary colour to the colour of the solution.
Why use complementary colours?
Remember from basic colour theory that the colour you see is complementary to the colour absorbed. For example:
- A blue solution appears blue because it absorbs other colours (especially yellow) and only allows blue light to pass through
- Yellow is the complementary colour to blue
- Therefore, to measure changes in a blue solution, use a yellow filter
The filter allows light of the complementary colour to pass through. As the concentration of the coloured species increases, more of this light is absorbed, and the absorbance reading increases.
Practical tip: The filter must be chosen to match the wavelengths most strongly absorbed by the coloured solution. For a blue solution, a yellow filter (wavelength nm) would be appropriate.
Quantitative analysis using colourimetry
The process for determining concentration using colourimetry is the same as for AAS:
- Prepare standard solutions with known concentrations
- Measure the absorbance of each standard solution
- Construct a calibration curve (concentration vs absorbance)
- Measure the absorbance of your unknown sample
- Use the calibration curve to determine the unknown concentration
Example calibration curve:
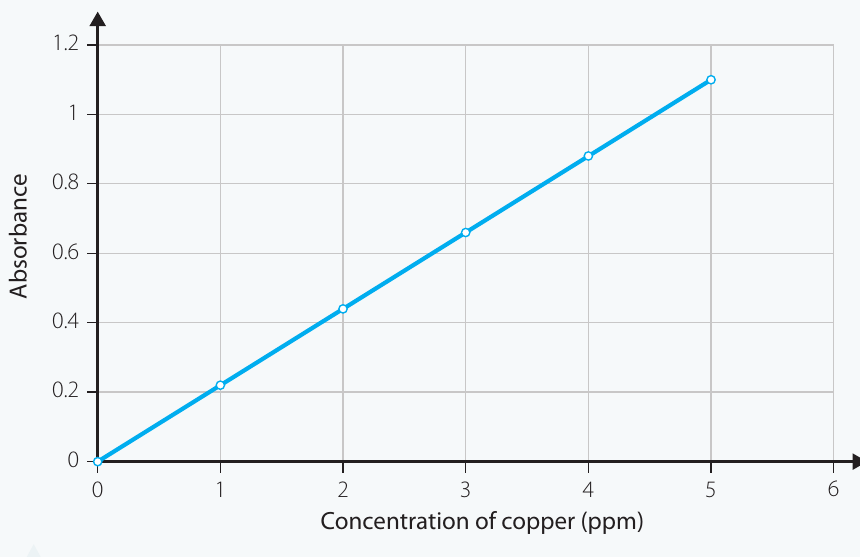
This graph shows a linear relationship between copper concentration and absorbance, typical of what you'd expect when constructing a calibration curve.
Investigation 14.6: Using colourimetry with copper(II) sulfate
Introduction
Copper sulfate solution has a blue colour, and the intensity of this colour is directly related to the solution's concentration. By measuring how much light passes through solutions of different concentrations, you can construct a calibration curve and use it to find the concentration of an unknown sample.
Aim
To determine the concentration of a copper(II) sulfate solution by constructing and using a calibration curve.
Materials
- Light source and light meter, colourimeter, or colourimeter data probe with data logger
- mL of mol L copper(II) sulfate solution
- Distilled water
- mL beaker
- mL measuring cylinder
Risk assessment
Safety considerations:
Consider the following risks and how to manage them:
- Use of chemicals (copper sulfate is harmful)
- Use of light meter or data logger (electrical safety)
- Handle chemicals carefully, wear appropriate PPE
- Follow equipment operating instructions
Method
Preparing standard solutions:
- Collect approximately mL of mol L copper(II) sulfate
- Measure mL into your cuvet or sample container
- Take an absorbance reading—this is for the mol L solution
- Prepare mol L solution: Measure mL of the mol L solution and make up to mL with distilled water
- Measure and record the absorbance
- Prepare mol L solution: Measure mL of stock solution and make up to mL
- Measure and record the absorbance
- Prepare mol L solution: Measure mL of stock solution and make up to mL
- Measure and record the absorbance
- Prepare mol L solution: Measure mL of stock solution and make up to mL
- Measure and record the absorbance
Testing unknown sample:
- Collect mL of the unknown concentration sample
- Measure and record its absorbance
Results and analysis
- Create a table showing known concentrations and their absorbances (include the unknown sample)
- Construct a fully-labelled calibration curve for the known results
- Use interpolation on the graph to determine the concentration of the unknown sample
- Check if your graph passes through the origin —it should, because zero concentration means zero absorbance
- Compare your results with other groups and discuss any differences
- Identify sources of error (random or systematic) that may have affected your results
Key points for analysis:
- Your calibration curve should be linear if measurements are accurate
- Any deviation from linearity may indicate systematic errors or concentration ranges where the relationship breaks down
- Comparing results with other groups helps identify random vs systematic errors in the experimental procedure
Key Points to Remember:
-
Instrumental techniques are more sensitive than traditional methods and can detect substances at concentrations below ppm.
-
Atomic absorption spectroscopy (AAS) uses light absorption by electrons to determine metal ion concentrations. The lamp must be made from the same element being tested to ensure only that element absorbs the light.
-
Colourimetry measures concentration using colour intensity. Use the complementary colour filter to the solution colour (e.g., yellow filter for blue solution).
-
Both techniques use calibration curves to determine unknown concentrations by comparing absorbance values of unknown samples with those of known standards.
-
Absorbance is related to concentration—as concentration increases, more light is absorbed (though the exact relationship depends on how the instrument measures).