Dynamic Equilibrium (HSC SSCE Chemistry): Revision Notes
Dynamic Equilibrium
Understanding dynamic equilibrium
Dynamic equilibrium occurs in chemical systems where a reversible reaction takes place within a closed environment. In these systems, reactants continuously form products while products simultaneously reform reactants. This means the reaction never fully completes. Instead, it reaches a balanced state where both forward and reverse processes continue at equal rates.
Dynamic equilibrium represents a specific type of steady state system. Steady state systems maintain constant properties over time. All systems at dynamic equilibrium exist in a steady state because their properties remain unchanged. However, the reverse is not always true.
A system can achieve a steady state without being at equilibrium. For example, if you add reactants at the same rate you remove products, the system maintains constant properties but never reaches true equilibrium.
How chemical systems reach equilibrium
When you first place reactants in a closed container, they exist at high concentration with no products present. The forward reaction proceeds rapidly because of these high reactant concentrations. The reverse reaction cannot occur initially since no products exist yet.
As the forward reaction proceeds, products begin to form and their concentration gradually increases. This allows the reverse reaction to start. The reverse reaction rate increases as more products become available. Meanwhile, the forward reaction slows down as reactants are consumed.
This pattern continues with two simultaneous changes:
- The forward reaction rate decreases as reactant concentration drops
- The reverse reaction rate increases as product concentration rises
Eventually, these two rates become equal. At this point, products form at exactly the same rate they break down back into reactants. The concentrations of all substances in the system remain constant. The system has reached dynamic equilibrium.
Characteristics of equilibrium systems
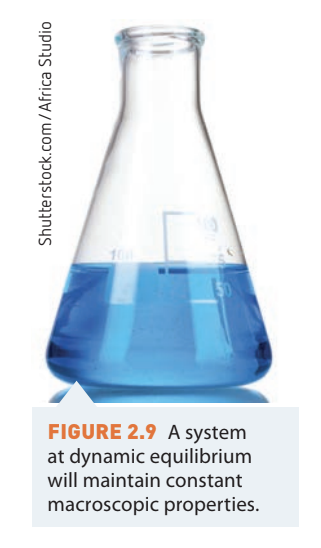
When a system reaches dynamic equilibrium, the concentrations of both reactants and products stay constant. This constancy extends to observable (macroscopic) properties. For instance, if a coloured substance is involved, the colour intensity remains unchanged. If a solid is present, its mass stays the same.
Important note: While concentrations must remain constant at equilibrium, they do not need to be equal. In most equilibrium systems, reactants and products exist in different amounts. The key is that these amounts no longer change.
Requirements for reaching equilibrium
For a chemical system to reach dynamic equilibrium, two essential conditions must be met:
- Closed system: No matter can enter or leave the system. Products must remain in the container to participate in the reverse reaction.
- Reversible reaction: The chemical reaction must be able to proceed in both directions. Products must be able to reform reactants.
At equilibrium, three key features are always present:
- The forward and reverse reaction rates are equal
- All concentrations remain constant over time
- Observable properties stay unchanged
Building shells: Equilibrium in nature
Many aquatic organisms depend on shells and skeletons made from calcium carbonate for structure and protection. The formation of these shells provides an excellent example of equilibrium occurring in nature.

When carbon dioxide dissolves in water, it undergoes a series of reversible reactions:
The hydrogen carbonate ion can react further to produce carbonate ions:
When calcium ions are present in the solution, they combine with carbonate ions to form insoluble calcium carbonate:
Although we classify calcium carbonate as insoluble, a very small amount can dissolve. Since this reaction is reversible, the system must reach equilibrium for solid calcium carbonate to form. This requires a saturated solution where no more calcium carbonate can dissolve.
You might think achieving a saturated solution in the vast ocean would be impossible. However, calcium carbonate has such low solubility that saturation does occur in seawater. Any excess ions can then form the solid calcium carbonate that marine organisms need for their shells, coral structures, and skeletons.
Investigation 2.2: Modelling equilibrium
This practical investigation models dynamic equilibrium using simple laboratory equipment. Two identical measuring cylinders represent the reactant and product containers. Different sized pipettes represent the forward and reverse reactions occurring at different rates.
Setup and method
The investigation uses two measuring cylinders labelled A and B. A graduated pipette transfers water from A to B, modelling the forward reaction. A graduated pipette transfers water from B to A, modelling the reverse reaction.
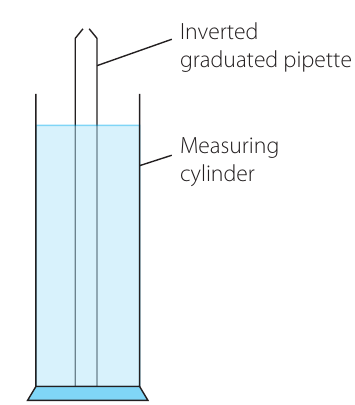
Initially, measuring cylinder A contains of water (representing reactants), while B is empty (no products). With each cycle, both transfers occur. The volumes in each cylinder are recorded after each complete cycle.
Safety considerations
Safety Note: When working with glassware in the laboratory, broken glass presents a cutting hazard. Keep all glassware away from bench edges and ensure pipettes are placed securely so they cannot roll off.
Analysis
After cycles, students graph the water volumes in both cylinders against cycle number. The slope of each line indicates the reaction rate. Initially, the "forward reaction" (A to B) is faster because more water is transferred. The "reverse reaction" (B to A) starts slowly but increases as more water accumulates in B.
Eventually, both lines level off when the forward and reverse transfer rates balance. The system reaches equilibrium when water transfers in both directions at the same net rate, even though different volumes are transferred in each direction.
This model effectively demonstrates how equilibrium is reached even when forward and reverse processes occur at different individual rates, provided the net effect becomes balanced.
Graphing equilibrium systems
Graphs provide powerful visual tools for understanding how chemical systems reach equilibrium. You can plot either reaction rates or concentrations against time to track a system's progress toward equilibrium.
Graphing reaction rate versus time
A graph of reaction rate versus time for a reversible reaction shows two distinct lines representing the forward and reverse reactions.

Starting with only reactants present, the graph shows:
- Forward reaction rate: Initially high, decreases rapidly at first then more gradually
- Reverse reaction rate: Initially zero (no products exist), increases rapidly at first then more gradually
- At equilibrium: Both rates become equal and remain constant
The point where the two lines meet marks the achievement of dynamic equilibrium. From this point onward, both reactions continue but at equal rates, so no net change occurs in the system.
Graphing concentration versus time
A concentration versus time graph tracks how the amounts of reactants and products change as the system approaches equilibrium. For the reaction :
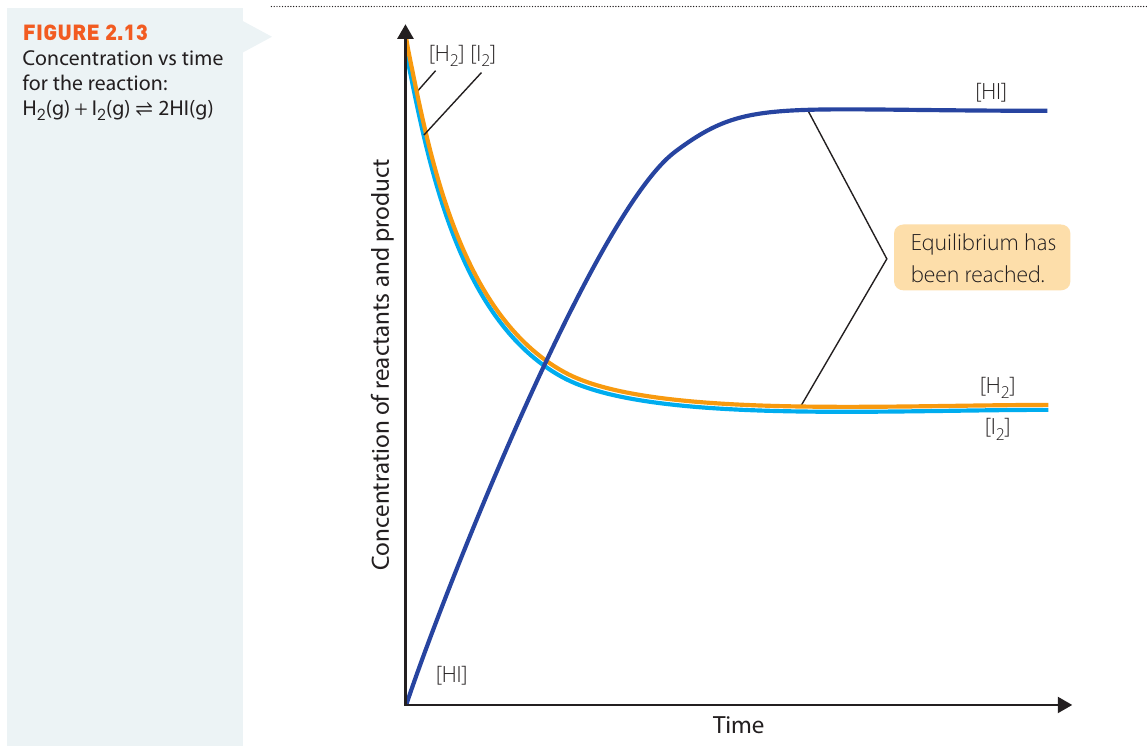
The graph reveals:
- Reactant concentrations: Start high, decrease steeply initially (steep negative slope), then level off
- Product concentration: Starts at zero, increases steeply initially (steep positive slope), then levels off
- At equilibrium: All lines become horizontal (zero slope), indicating constant concentrations
The number of lines on the graph depends on how many different substances are involved. Each reactant and product appears as a separate line. All lines plateau when equilibrium is reached, though they plateau at different heights because concentrations don't need to be equal.
Comparing the two graph types
| Graph type | Number of lines | Appearance at equilibrium |
|---|---|---|
| Concentration vs time | One line for each reactant and product (multiple lines possible) | All lines become horizontal at constant concentrations (concentrations need not be equal) |
| Reaction rates vs time | Two lines (forward reaction and reverse reaction) | Both lines meet and plateau at the same height (rates are equal) |
Key difference: Rate graphs always show exactly two lines that must meet at the same value. Concentration graphs can show any number of lines that plateau at potentially different values.
Exam tips
Tips for Success:
-
When sketching concentration graphs, remember that reactant lines decrease while product lines increase, but they don't need to end at the same height.
-
For rate graphs, the two lines must always meet and plateau at the same value - this represents equal rates at equilibrium.
-
Always label your axes clearly: "Rate" or "Concentration" for the y-axis, and "Time" for the x-axis.
-
Use the steepness (slope) of concentration graphs to indicate how quickly reactions proceed. Steep slopes show rapid changes, while gentle slopes show slower changes.
Remember!
Key Points to Remember:
-
Dynamic equilibrium occurs when forward and reverse reaction rates become equal in a closed system with a reversible reaction.
-
At equilibrium, concentrations remain constant (but need not be equal), and observable properties don't change.
-
Two essential requirements for equilibrium: a closed system and a reversible reaction.
-
Rate versus time graphs show two lines that meet and plateau when equilibrium is reached.
-
Concentration versus time graphs show multiple lines (one per substance) that all become horizontal at equilibrium, though at potentially different heights.