Measuring Solubility (HSC SSCE Chemistry): Revision Notes
Measuring Solubility
Introduction to solubility
Temperature affects how much of a substance can dissolve in a solvent. Solubility describes the maximum amount of a substance (in grams) that can dissolve in of solvent at a specific temperature.
Understanding solubility is crucial in chemistry because it helps us predict how substances will behave when mixed with solvents at different temperatures.
Practical Applications
Solubility concepts are essential for understanding:
- Crystallization processes in laboratories and industry
- Purification of compounds through recrystallization
- Solution formation and precipitation reactions
- Pharmaceutical formulation and drug delivery
Types of solutions
Saturated solutions
When you add sugar to a cup of water, you'll eventually reach a point where no more sugar can dissolve at that particular temperature. Any extra sugar will remain at the bottom of the cup. This is called a saturated solution - it contains the maximum amount of solute that can dissolve at that temperature.
A saturated solution represents an equilibrium state where the rate of dissolution equals the rate of crystallization. At this point, the solution cannot hold any more solute at the current temperature.
Unsaturated solutions
Before reaching the saturation point, you have an unsaturated solution. This means the solution can still dissolve more solute at the current temperature. There is still "room" for more solute particles to be accommodated by the solvent molecules.
Supersaturated solutions
A supersaturated solution contains more dissolved solute than a saturated solution at the same temperature. This creates an unstable state.
Creating a Supersaturated Solution
To create a supersaturated solution, follow these steps:
Step 1: Heat a saturated solution to dissolve more solute
Step 2: Carefully cool the solution without disturbing it
Step 3: The extra solute remains dissolved, creating a supersaturated state
Instability of Supersaturated Solutions
If the supersaturated solution is bumped, a crystal is added, or the container is scratched, the excess solute will rapidly precipitate out. This occurs because the solution is thermodynamically unstable.
Real-world Example: Toffee Manufacturing
Toffee is a supersaturated solution of sugar. To prevent crystallization and maintain its smooth texture, manufacturers use a mixture of different sugars or add fats to stabilize the solution.
Solubility curves
What are solubility curves?
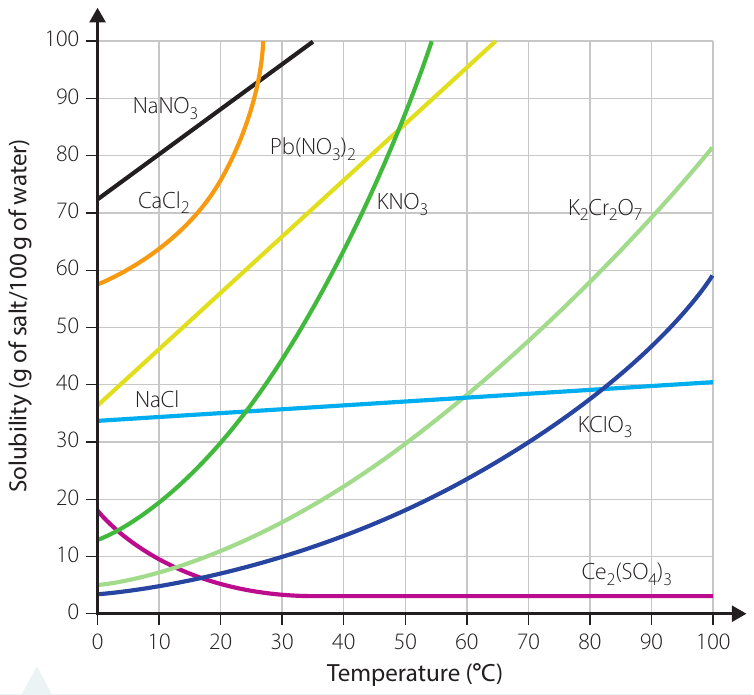
Solubility curves are graphs that display the relationship between temperature and the amount of solute that can dissolve. These curves provide valuable information about how solubility changes with temperature.
Understanding the Graph Components
The graph shows:
- x-axis: Temperature (measured in °C, typically from to )
- y-axis: Solubility (measured in grams of salt per of water)
- Curves: Each line represents a different substance
General trends
For most salts, solubility increases as temperature rises. This is shown by upward-sloping curves on the graph. However, some substances show unusual behaviour:
- Sodium chloride (NaCl): Shows minimal change in solubility with temperature (nearly horizontal line)
- Cerium sulfate (): Demonstrates retrograde solubility - its solubility actually decreases as temperature increases (downward-sloping curve)
Retrograde Solubility
Retrograde solubility is unusual behaviour where solubility decreases with increasing temperature. This is rare among common salts and has important implications for crystallization processes.
Different substances show different rates of solubility increase:
- Potassium nitrate (): Steep curve, very sensitive to temperature changes
- Potassium chlorate (): Moderate increase with temperature
- Sodium nitrate (): Steep positive slope, highly temperature-dependent
Reading solubility curves
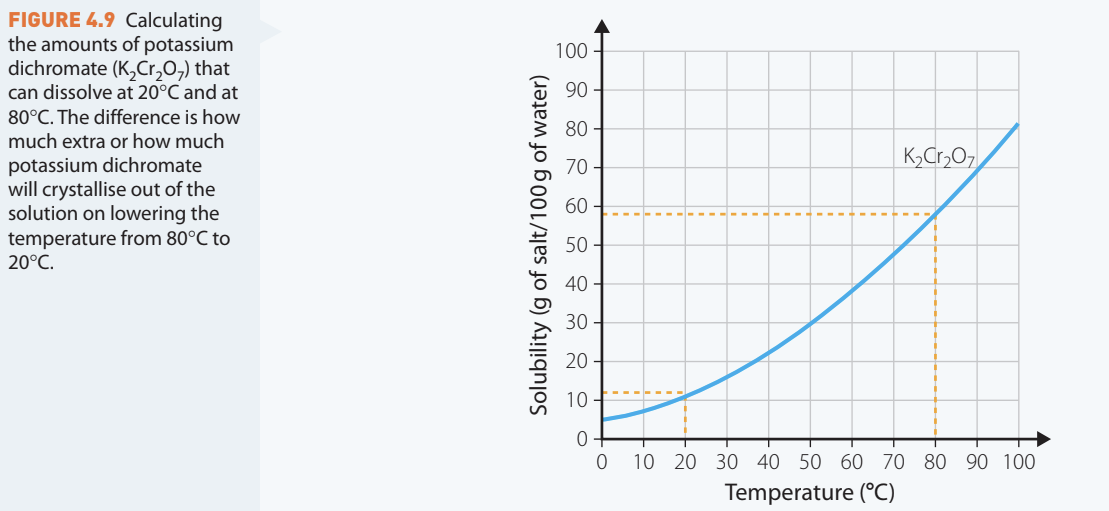
To use a solubility curve effectively, you need to understand how to extract information from it. Let's work through an example using potassium dichromate ().
Worked example: Potassium dichromate
Worked Example: Determining Solubility at 20°C
Question 1: How much potassium dichromate will dissolve at ?
Solution:
Step 1: Locate on the temperature (x) axis
Step 2: Draw a vertical line upward until it meets the curve
Step 3: From this intersection point, draw a horizontal line to the y-axis
Step 4: Read the solubility value
Answer: Approximately of will dissolve in of water at .
Worked Example: Calculating Additional Solubility
Question 2: How much extra will dissolve at ?
Solution:
Step 1: Repeat the process for
Step 2: At , approximately will dissolve
Step 3: Calculate the difference:
Answer: An extra of will dissolve when the temperature increases from to .
Important Application: Crystallization
This calculation also tells us how much potassium dichromate would crystallize out if a saturated solution at were cooled to . The answer is per of water.
Exam Tip: Accurate Graph Reading
When reading solubility curves, always use a ruler or straight edge to draw accurate lines. Small errors in reading the graph can lead to incorrect calculations.
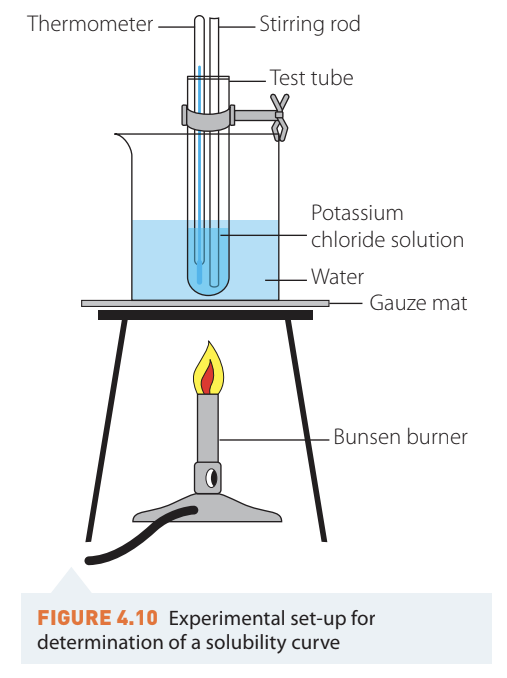
Experimental determination of solubility curves
Understanding how to determine solubility curves experimentally is important for both practical skills and understanding the concept of solubility.
Investigation: Deriving the solubility curve for potassium chloride
Aim
To gather experimental data and construct a solubility curve for potassium chloride.
Principle
The experiment works by creating a saturated solution at a high temperature, then cooling it until crystals first appear. The temperature at which crystals begin to form is the saturation temperature for that particular concentration.
Equipment needed
- Potassium chloride (solid)
- Distilled water ( per group)
- Large test tube
- beaker (water bath)
- Thermometer ( to )
- Stirring rod
- Bunsen burner with tripod and gauze mat
- Balance
- Boss head and clamp
- Safety glasses
Method
Step 1: Weighing: Accurately weigh the assigned mass of potassium chloride (ranging from to depending on your group)
Step 2: Preparation: Place the weighed potassium chloride into a large test tube and add exactly of distilled water
Step 3: Water bath setup: Half-fill a beaker with tap water. Clamp the test tube securely so it is immersed in the water bath
Step 4: Heating: Gently warm the water bath using a Bunsen burner. Continuously stir the contents of the test tube with the stirring rod until all the potassium chloride has completely dissolved
Step 5: Cooling and observation: Allow the test tube to cool while continuing to stir. Watch carefully for tiny crystals to start appearing
Step 6: Recording: Note the exact temperature when crystals first appear (the recrystallization temperature). This is the saturation temperature for your concentration
Safety considerations
Risk: Bunsen burners get very hot
Management: Ensure long hair is tied back, keep the flame away from flammable materials, and never use a burner with a damaged gas tube. If burned, immediately place the affected area under cold running water for 20 minutes and inform your teacher.
Risk: Broken glassware causes cuts
Management: Inspect all glassware before use and discard any chipped or cracked items. If glass breaks, use a brush and dustpan to clean up - never use your fingers.
Results
| Group | Mass of potassium chloride (g) | Mass of water (g) | Temperature of recrystallization (°C) | Solubility (g/100g H₂O) |
|---|---|---|---|---|
| 1 | 3.00 | 10.00 | ||
| 2 | 3.40 | 10.00 | ||
| 3 | 3.80 | 10.00 | ||
| 4 | 4.20 | 10.00 | ||
| 5 | 4.60 | 10.00 | ||
| 6 | 5.00 | 10.00 |
Calculating Solubility
To calculate solubility in water from your results, multiply the mass of potassium chloride by 10 (since you used of water, not ).
Worked Example: Solubility Calculation
If Group 1 used of KCl in water, the solubility would be:
Analysis
After collecting class data, plot a graph with:
- x-axis: Temperature ()
- y-axis: Solubility ( water)
Join the points with a smooth curve. This is your experimental solubility curve for potassium chloride.
Evaluating accuracy
You can calculate the percentage error of your experiment using:
Worked Example: Calculating Percentage Error
If the theoretical solubility of potassium chloride at is , and your experiment gave :
Common Sources of Error
- Difficulty in identifying exactly when crystals first appear
- Heat loss during cooling leading to faster temperature drop
- Impurities in the potassium chloride or water
- Incomplete dissolution of the salt before cooling
- Inaccurate temperature readings
Experimental Improvements
To improve accuracy:
- Cool the solution more slowly for better observation
- Use a digital thermometer for more accurate temperature measurement
- Repeat the experiment multiple times and take an average
- Ensure thorough stirring throughout the process
Exam Tip: Recording Crystallization Temperature
In practical exams, make sure you record the temperature the moment you see the first crystals appear. Waiting too long will give an inaccurately low temperature reading.
Remember!
Key Points to Remember:
-
Solubility is the maximum mass (in grams) of a substance that can dissolve in of solvent at a specific temperature
-
A saturated solution contains the maximum amount of dissolved solute at that temperature, while an unsaturated solution can dissolve more solute
-
Supersaturated solutions contain more solute than a saturated solution at the same temperature and are unstable
-
Solubility curves are graphs showing how solubility changes with temperature, with most salts showing increased solubility at higher temperatures
-
To read a solubility curve, draw vertical and horizontal lines from the temperature and curve to find the solubility value at any given temperature