Scientific Investigations (HSC SSCE Chemistry): Revision Notes
Scientific Investigations
Designing your investigation
When designing a scientific investigation, you need to carefully consider several important factors including time, resources, and your starting research question or hypothesis. Proper planning ensures your investigation can answer your research question effectively.
Posing questions and formulating hypotheses
The first step is choosing an interesting topic. If working in a group, find something that interests everyone. Use brainstorming to generate ideas:
Brainstorming Guidelines:
- Write down all ideas without criticism initially
- Get everyone to contribute
- Accept all contributions
- Create a long list of possibilities
After brainstorming, critically evaluate your ideas:
- Select the most interesting questions
- Consider what is scientifically possible given your time and resources
- Remember that your group's skills are your most important resource
- Create a short list of questions
- Keep the long list for reference
Refining your question through literature review
Your depth study extends knowledge you've encountered in your chemistry course. The next step involves conducting a literature review to find out what is already known about your topic.
A literature review involves more than just summarising information. It requires:
- Coherently presenting available research on the topic
- Critically analysing research methodology and data analysis
- Identifying areas where further research could be conducted
Finding reliable sources:
The CRAAP Test for Evaluating Sources:
Use the CRAAP test to evaluate websites you find. The most valid sources include:
- Educational institutions (particularly universities)
- Government organisations (CSIRO, ANSTO)
- Professional organisations (Royal Australian Chemical Institute)
- Peer-reviewed scientific journals
Search tips:
Use search terms like 'site.edu' or 'site.gov' to narrow your search to educational or government sources only.
Record keeping:
Scientists use logbooks to record all their work. You should:
- Record information you find
- Note all references
- Attach printouts
- Keep everything organised
This saves time later and helps with proper referencing.
Proposing a research question or hypothesis
After researching, you need to define either a research question or a hypothesis.
Good research questions:
- Are specific enough to guide your investigation design
- Identify the variables to be investigated
- Usually have one independent variable and one dependent variable
- Are answerable with available time and equipment
Example of a Good Research Question:
"Will a reaction occur more quickly if the temperature is higher?"
This tells you:
- What you will vary (temperature) - the independent variable
- What you will measure (reaction rate) - the dependent variable
- How to judge if you've answered the question
Example of a Poor Question:
"What will make a reaction occur the best?"
This question:
- Doesn't specify what will be varied
- Doesn't tell when you've answered it
- Uses vague terms like "best"
Avoid vague, open-ended questions that don't specify measurable variables.
Hypothesis:
A hypothesis is a tentative explanation or prediction not yet confirmed by experiment.
Example Hypothesis:
"As the temperature of the sodium thiosulfate solution increases, the rate of reaction with hydrochloric acid will increase."
A good hypothesis:
- Gives a testable prediction (ideally quantitative)
- Is based on an existing model or theory
- Makes a prediction about what will happen in a specific situation
Important points about hypotheses:
Understanding Hypothesis Testing:
- If experimental results disagree with your hypothesis, you may have disproved it (this is not bad - it leads to new questions)
- If experiments agree with predictions, they support your hypothesis (this increases confidence but doesn't prove it true)
- Never write "To prove..." as an aim - you can only disprove, not prove, a hypothesis
- Questions and hypotheses may change during your investigation
Designing and planning your scientific investigation
Careful planning ensures you collect the data needed to test your hypothesis.
Equipment considerations:
- Think about the most appropriate equipment for collecting data
- Consider precision - a volumetric flask, burette, or pipette may be more precise than a measuring cylinder
- Plan the order of tasks for time efficiency
- Coordinate with other groups if sharing specialist equipment
- Assign roles if working in a group
Planning questions to consider:
| PRIMARY SOURCE INVESTIGATION | SECONDARY SOURCE INVESTIGATION |
|---|---|
| What data will you need to collect? | What information will you need to gather? |
| What materials and equipment will you need? | What sources will you use? |
| When and where will you collect the data? | When and where will you gather the information? |
| If working in a group, what tasks are assigned to which people? | If working in a group, what tasks are assigned to which people? |
| Who will collect the data? | Who will collect what information? |
| Who will be responsible for recordkeeping? | How will recordkeeping be done to avoid plagiarism? |
| How will the data be analysed? | How will the information be analysed? |
| How will sources be referenced? | How will sources be referenced? |
Ensuring validity, reliability and precision:
| PRIMARY INFORMATION AND DATA | SECONDARY INFORMATION AND DATA | |
|---|---|---|
| Validity | Does the investigation test the hypothesis? Are all variables controlled except the one being investigated? | Does the information relate to the investigation's hypothesis? Is the author qualified? Is the research recent and relevant? |
| Reliability | Has the method been repeated appropriately? Are results consistent? | Is the information found in several authoritative sources consistent? |
| Precision and accuracy | Have you used the best measuring equipment available and used it correctly? Have you minimised uncertainties? | Are data given with uncertainties that are small compared to measured values? |
Understanding Variables:
- Independent variable: The one you change
- Dependent variable: The one you measure
- Controlled variables: All others must be kept constant
Control all variables except the independent variable to ensure your investigation is valid.
Data collection:
- Take repeat measurements to check reliability
- A result is reliable if repeats give the same result within experimental uncertainty
- An experiment is reproducible if different people can repeat it and achieve the same results
- Collect to data points minimum for linear relationships
- Collect more data points for non-linear relationships
- Space data points carefully - collect more where rapid variation is expected
Time Management Tips:
Plan to have enough time to:
- Perform experiments (including repeats)
- Learn how to use new equipment
- Analyse results
- Report findings
Record your planning:
Keep a detailed record in your logbook showing:
- What you plan to do
- Why you're doing it
- Who will do what (if working in a group)
Working safely through risk assessment
Before beginning your investigation, complete a risk assessment by considering:
- What are the possible risks (to people, environment, or property)?
- How likely is injury or damage?
- How serious would the consequences be?
Risk matrix:
| LIKELIHOOD ↓ | NEGLIGIBLE | MARGINAL | SEVERE | CATASTROPHIC |
|---|---|---|---|---|
| Rare | Low risk | Low risk | Moderate risk | High risk |
| Unlikely | Low risk | Low risk | High risk | Extreme risk |
| Possible | Low risk | Moderate risk | Extreme risk | Extreme risk |
| Likely | Moderate risk | High risk | Extreme risk | Extreme risk |
| Certain | Moderate risk | High risk | Extreme risk | Extreme risk |
Risk management:
After identifying risks, plan how to:
- Minimise them
- Deal with consequences if something happens
Example Risk Assessment:
| WHAT ARE THE RISKS? | HOW TO MANAGE THESE RISKS |
|---|---|
| mol L HCl is corrosive to skin and clothes | Clean up all spills immediately. Wear safety glasses and wash hands after handling the chemical. |
Safety Requirements:
Your investigation must be low risk. Check safety data sheets for all chemicals used or produced.
Conducting your investigation
If you've planned carefully and can use the equipment properly, your experiments should go smoothly.
Recording data:
- Record data immediately with correct units and uncertainties
- Raw data (data collected during investigation) goes directly into your logbook
- Download data from data loggers and add to your logbook with file references
- Draw tables with column headings showing names and units
- Record uncertainty at top of column or in each cell
Tips During Data Collection:
- Start analysis while collecting data
- If you spot an outlier, repeat that measurement
- Put a line through mistakes, write the new data, and add a comment
- Plotting and analysing as you go may reveal something interesting
- You may need to revise your hypothesis or question
Estimating uncertainties
All experimental data has uncertainty from several sources:
- Limit of reading of measuring devices
- Precision of measuring devices
- Variation of the measurand (variable being measured)
Limit of reading:
For analogue devices (continuous scales like liquid thermometers):
Limit of Reading for Analogue Device:
A thermometer marked in °C has:
For digital devices (display a number):
Limit of Reading for Digital Device:
A digital thermometer reading to whole degrees has:
You don't know if it rounds up or down.
Device precision:
Measuring devices have a precision usually given in the user manual.
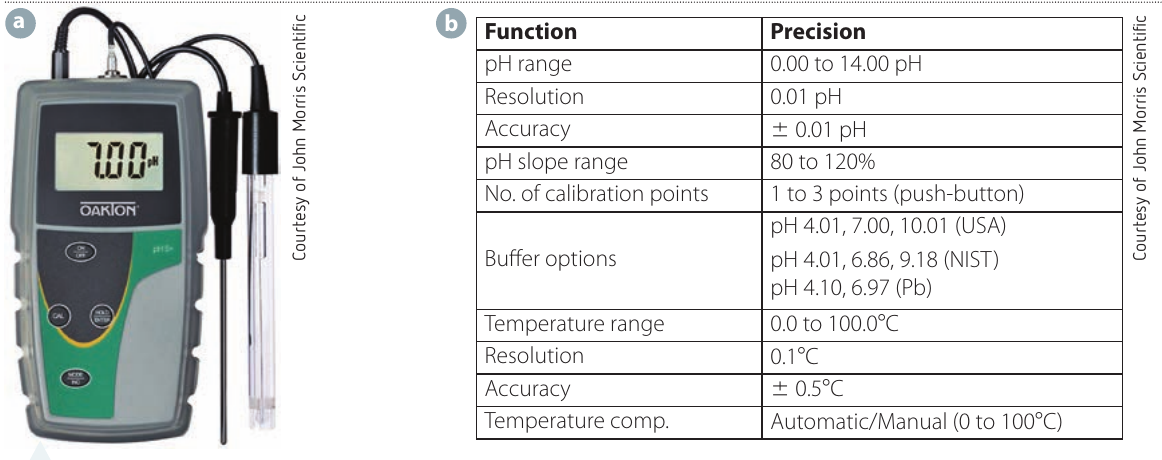
Worked Example: Device Precision Uncertainty
A pH meter may have precision of on a voltage scale. If you measure V:
Step 1: Calculate uncertainty from precision
Step 2: Compare to limit of reading
- Precision uncertainty: V
- Limit of reading uncertainty: V
The precision uncertainty ( V) is greater than the limit of reading uncertainty ( V).
A digital device may be easier to read but is not necessarily more precise. The precision uncertainty is usually greater than the limit of reading.
Variation of measurand:
Even with identical conditions, repeat experiments rarely give exactly the same results. Making repeat measurements allows you to estimate the size of variation.
For a single varying measurement:
Watch and record maximum and minimum values.
Worked Example: Fluctuating Measurement
If a multimeter reading fluctuates between V and V:
Step 1: Calculate range
Step 2: Calculate measurand
Step 3: Calculate uncertainty
Result: Record as V
For repeat measurements:
Best estimate of measurand = average value
If fewer than 10 measurements:
If more than 10 measurements:
where is an individual value, is the average, and is the total number of measurements.
Most calculators and spreadsheet software can calculate standard deviation automatically.
Random vs systematic errors:
- Random errors: Cause repeated measurements to be randomly spread about the true value. This is why we take averages.
- Systematic errors: Include calibration errors and parallax errors. These must be avoided during planning and conducting the investigation.
Analysing data
After collecting data, you need to analyse it. Record all analyses in your logbook.
Performing calculations with your data
When calculating with data:
- Include units with all numbers
- Convert to standard units if needed (e.g., mL to L)
- This ensures correct units for all derived data
Significant Figures:
Pay attention to significant figures when performing calculations. (See Appendix for rules on adding and subtracting significant figures.)
Identifying trends, patterns and relationships
While you might see patterns in tables, graphs make patterns and relationships much clearer, especially for quantifying relationships (e.g., linear vs exponential).
Good graph characteristics:
- Large and clear
- Axes labelled with variable names and units
- Independent variable on x axis
- Dependent variable on y axis
- Scale chosen so data takes up most of plot area
- Origin not necessarily shown (often no reason to include it)
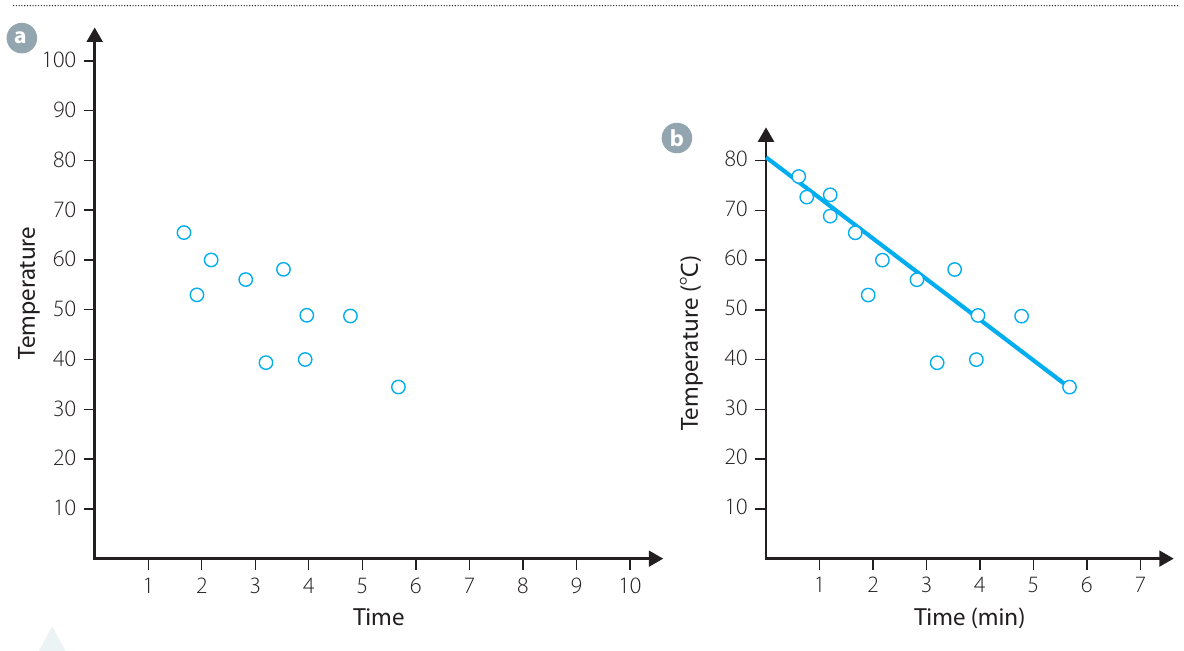
Scatter plots:
When looking for relationships between variables, use a scatter plot:
- Show data as points
- Do NOT join them dot-to-dot
- Need at least data points for linear relationships
- Need more data points for non-linear relationships
- Collect more data where rapid variation is expected
Linear relationships:
If the graph is linear, fit a straight line of best fit:
- Use graphing software or draw by hand
- Linear regression tools calculate (goodness of fit)
- close to (or ) indicates good fit
- Typically need for a linear relationship
Line of best fit equation:
where:
- = dependent variable (vertical axis)
- = independent variable (horizontal axis)
- = gradient
- = intercept
Never force a line through the origin. The intercept gives useful information and may indicate systematic errors.
Outliers:
Points that don't fit the pattern may be:
- Mistakes in recording or measurement
- Indicating non-linear behaviour at extreme values
- You may ignore outliers when fitting lines, but justify why
Extrapolation vs interpolation:
- Extrapolation: Extending the line beyond measured points. Be cautious - you have no evidence the system behaves the same way outside your data range.
- Interpolation: Using data points from the line of best fit that weren't original measurements. If the line fits well, you can have confidence in interpolated data.
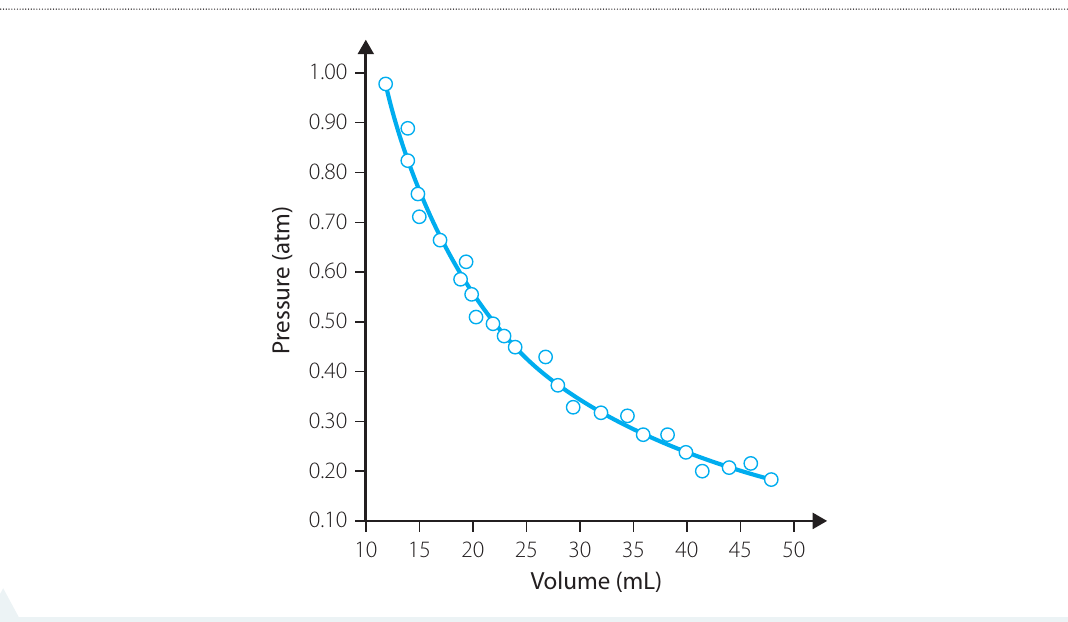
Non-linear relationships:
If your data forms a curve:
- Don't draw a straight line through it
- If your hypothesis predicts the curve shape, try fitting a theoretical curve
- You may only be able to state descriptive relationships (e.g., "one variable increases with another" or "there is a peak at this position")
Types of Graphs:
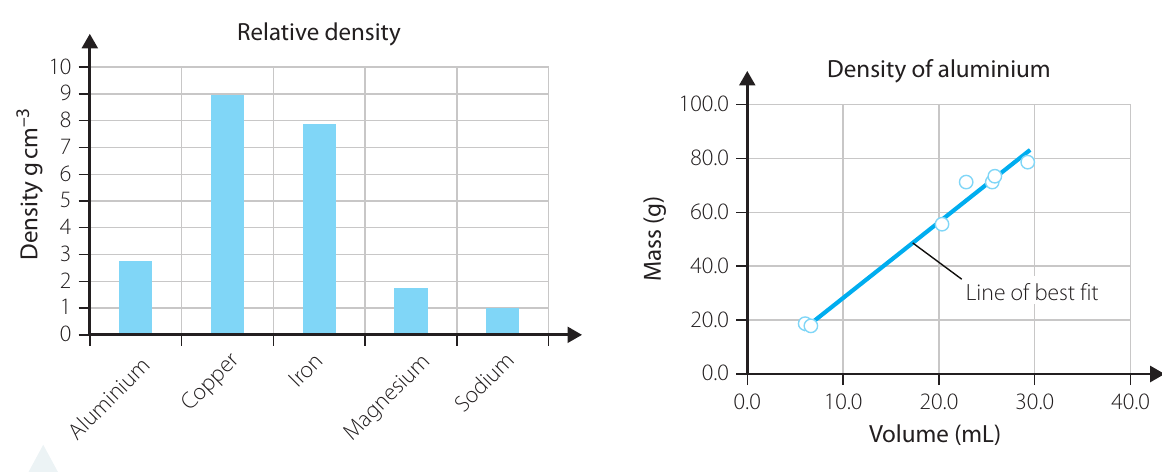
- Scatter plot: Shows mathematical relationships between continuous variables
- Column graph: Compares discrete data sets (e.g., different categories)
- Do NOT use column graphs to show mathematical relationships
Interpreting your results
After analysing results, interpret them by:
Answering your research question or testing your hypothesis:
If hypothesis not supported, don't just say "our hypothesis is wrong." Investigate what went wrong:
- Check equipment was correctly calibrated and used
- Verify all data recorded in correct units
- Check units carried through calculations correctly
- Review your analysis carefully
- Consider if other factors affected results
- Identify variables not controlled or forgotten
When Results Don't Match Predictions:
Experiments that don't support predictions are crucial for scientific progress. They tell us there's more to discover and inspire curiosity. A "failed" hypothesis isn't a failed experiment - it's new knowledge about what doesn't work, which is equally valuable.
Communicating your understanding
Research is not complete until results are communicated. Scientists communicate through:
- Reports (most common)
- Posters
- Demonstrations
- Public lectures
- Websites
- Videos
- Blogs
Select the mode that best suits your:
- Content
- Audience
- Purpose
Use appropriate language and style for your audience.
Posters and websites:
- Use many images (more appealing than words)
- Ensure images are relevant and communicate information
- Consider accessibility (large, clear fonts)
- Include tags for digital images
Writing reports
A report is a formal, carefully structured account of your investigation. It's based on your logbook but contains only a summary.
Report characteristics:
- Written in past tense (describes what you did)
- Formal structure with distinct sections
- Contains small fraction of what's in logbook
- Logbook has all ideas, rough working, and raw data
- Report has refined, selected information
Report structure:
1. Abstract
- Very short summary of entire report (- words)
- Appears at start but written last
- Try one sentence to summarise each part
2. Introduction
- Explains why you did this investigation
- States research question or hypothesis
- Explains why research is interesting
- Includes literature review with background information
- Must reference all sources correctly
3. Method
- Summarises what you did
- States what you measured and how
- Explains briefly why you chose particular methods
- For primary investigations: describes experiments in enough detail for repetition
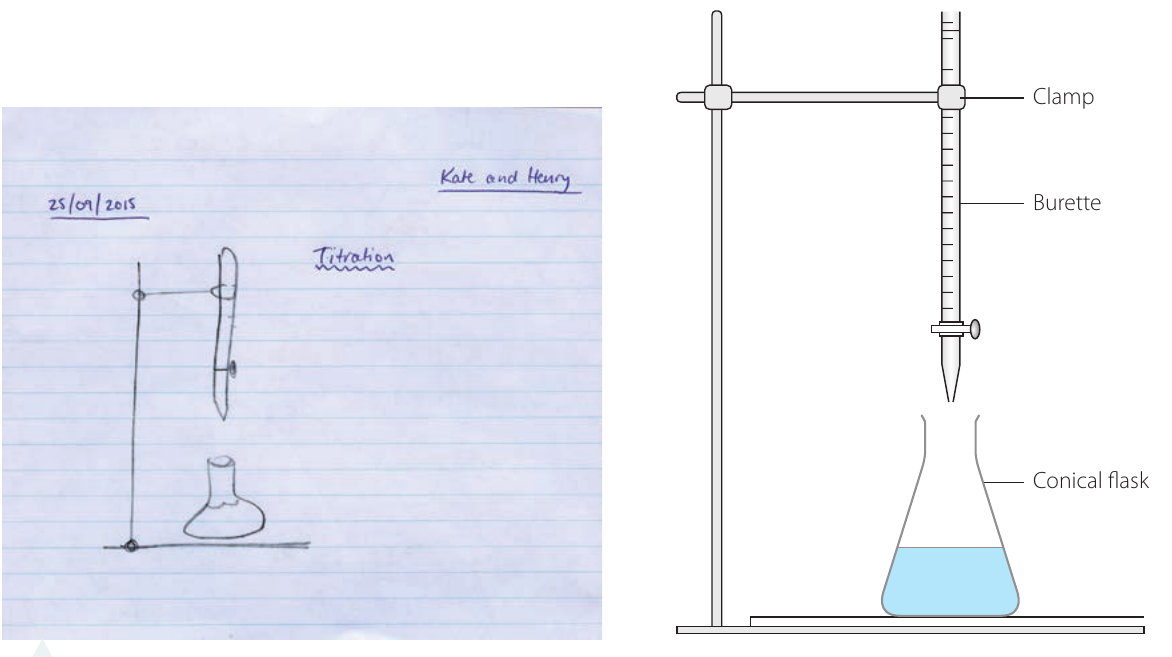
- Includes large, clear diagrams of equipment set-up
- Redraw rough logbook sketches neatly
- For secondary investigations: describes literature searches and source selection
4. Results and Analysis
- Summary of your results (usually combined with analysis)
- Uses tables comparing results
- Avoid long tables of raw data (put in appendix if needed)
- Uses graphs instead of tables where possible
- Graphs should show averages, not all raw data
- Choose appropriate graph type:
- Scatter plot for relationships between variables
- Column graph for comparing data sets
- Includes data with correct units and uncertainties
- Shows equations used for calculations
- Shows one example calculation (not multiple repeats)
5. Discussion
- Summarises what results mean
- Answers research question or states if hypothesis supported
- If hypothesis not supported, explains why
- Identifies further questions arising from investigation
- Describes further work needed
6. Conclusion
- Very brief summary of results and implications
- States what you found out and what it means
- Only a few sentences long
7. Acknowledgements
- Thanks people and organisations who helped
- Includes equipment or funding suppliers
- People who gave ideas or helped with analysis
8. References
- Details all sources used in the report
- Longer for secondary source investigations
- Information or quotations referenced at point of use
- Either numbered (e.g., [2]) or author-year format (e.g., Jones, 2016)
- Complete list at end of report or footnotes at page end
Bibliography vs References:
- Bibliography: List of sources useful for understanding research (may not all be used in report)
- References: Sources actually used in report (subset of bibliography)
- Primary source investigations: no bibliography needed
- Secondary source investigations: may include both
9. Appendices
- Additional material attached at end
- Long tables of raw data
- Extended calculations
Ideas for depth studies
Throughout your chemistry course, you'll find investigation suggestions in each chapter:
- Detailed investigations: Training exercises for learning primary investigation skills
- Less detailed suggestions: Ideas for carrying out primary investigations
- Depth study suggestions: At end of each module, with ideas building on module content
Generate your own ideas by:
- Reading about topics you're interested in
- Considering skills from other areas (art, music, etc.)
- Discussing with your teacher
- Reviewing module-specific depth study suggestions
Carrying out depth studies helps you:
- Extend your chemistry knowledge and understanding
- Learn how to work scientifically
- Learn how to do chemistry
Remember!
Key Points to Remember:
-
Investigation design starts with a clear research question or hypothesis that identifies variables and is answerable with available resources.
-
Validity, reliability and precision are essential. Control all variables except the independent variable, repeat measurements, and use appropriate equipment.
-
Uncertainty in measurements depends on limit of reading, device precision, and measurand variation. Always record data with units and uncertainties.
-
Data analysis involves calculations, graphing and interpretation. Use scatter plots for relationships, column graphs for comparisons. Never force lines through the origin.
-
Formal reports follow a structured format: abstract, introduction (with literature review), method, results and analysis, discussion, conclusion, acknowledgements, references, and appendices. All sources must be referenced correctly.