Trends in Australia's Trade Patterns and Financial Flows (HSC SSCE Economics): Revision Notes
Trends in Australia's Trade Patterns and Financial Flows
Australia as a small, open economy
Australia occupies a unique position in the global economy. While it ranks as the 12th largest economy worldwide, this places it between larger economies like Brazil and South Korea, making it relatively small compared to economic giants such as the United States, China, the EU and Japan. Despite this modest size, Australia demonstrates a very high level of economic development, ranking fifth globally on the United Nations' Human Development Index for quality of life.
Australia's position as both a developed economy and a relatively small global player creates a unique set of economic characteristics and challenges that distinguish it from both larger developed economies and smaller developing nations.
Australia is classified as a small, open economy. This means the Australian economy produces less than 2% of Gross World Product but remains highly integrated with global markets. Trade plays a central role in Australia's economic activity, with exports accounting for more than one-quarter of domestic production and imports representing almost one-quarter of GDP. This high level of trade dependence means that while Australia has limited influence on global economic developments, changes in the world economy can significantly impact Australia's economic performance.
Key characteristic of small, open economies: They are "price takers" in global markets, meaning they must accept international prices for their exports and imports rather than being able to influence them. This makes them particularly vulnerable to external economic shocks and global price fluctuations.
Trade has historically been important to Australia for several reasons:
- Strong overseas demand for primary commodities (minerals and agricultural products)
- A developed services sector, particularly in tourism and education
- The need to import technology and goods not produced domestically due to Australia's relatively small population
The changing direction of Australia's trade
Historical shifts in trading partners
Australia's trade relationships have undergone dramatic transformation over recent decades. These changes reflect both shifting global economic power and Australia's geographic position in the Asia-Pacific region.
The United Kingdom era (pre-1973): Prior to 1973, the United Kingdom served as Australia's primary trading partner, reflecting historical ties from Australia's colonial past. This relationship changed fundamentally when the UK joined the European Economic Community (now the European Union) in 1973. Membership required the UK to impose the same trade barriers on Australian goods as on other non-EU countries, effectively giving preference to European trade. This shift forced Australian exporters to lose many traditional agricultural export markets in the UK.
The UK's entry into the European Economic Community in 1973 represented a critical turning point in Australian trade history. This event forced Australia to fundamentally reorient its trade relationships toward the Asia-Pacific region, a shift that would prove economically beneficial in the long term.
The Japan boom (1960s-1990s): When European markets became less accessible, Australian exporters redirected their focus toward North-East Asian and ASEAN countries. Japan's rapid economic growth in the 1960s created strong demand for minerals and energy, making Japan Australia's largest export market by the 1970s. However, Japan's share of Australian trade began declining around 1990 and has continued to shrink, reflecting both Japan's weaker economic growth and Australia's diversification to other regional markets.
The rise of China (2000s-present): The early 2000s marked the beginning of sustained rapid growth in exports to China. Since 2007, China has been Australia's largest trading partner (when combining imports and exports). This dominance reflects China's increasing significance in the global economy and Australia's role as a major commodity supplier.
Current major trading partners
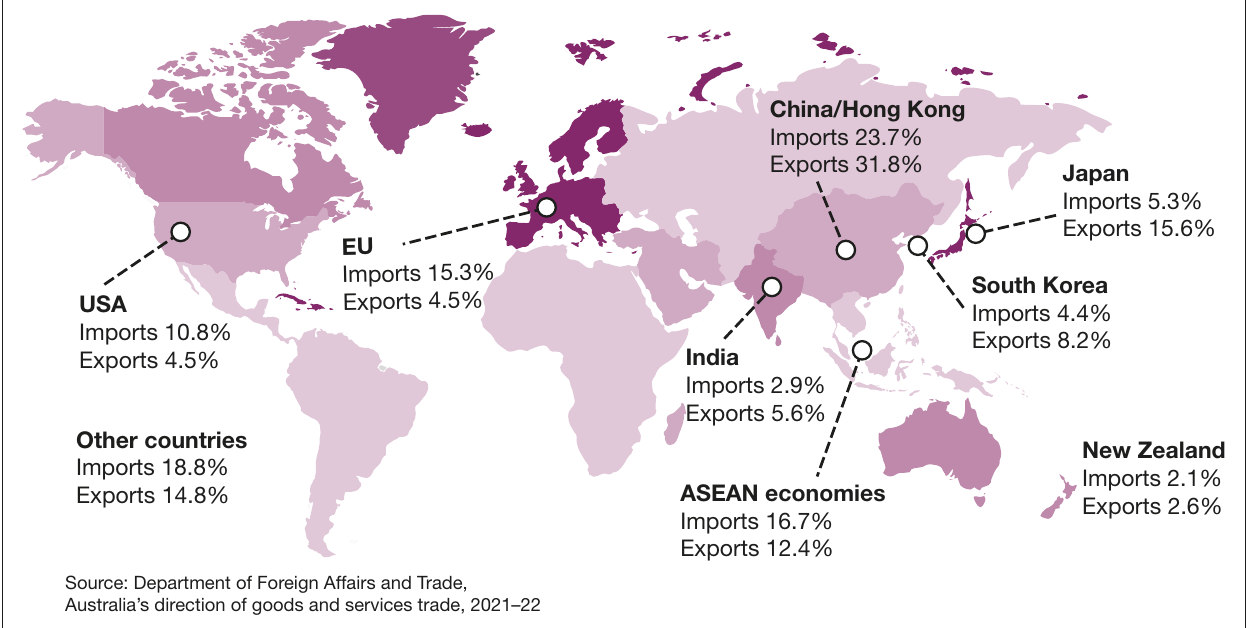
The map above illustrates Australia's trading relationships in 2021-22. China clearly dominates, accounting for 31.8% of Australia's exports and 23.7% of imports. This makes China's share of exports more than double that of Japan (15.6%), Australia's second-largest export market.
Other significant trading partners include:
- ASEAN economies (Indonesia, Thailand, Vietnam, Singapore, Malaysia, Philippines): 12.4% of exports, 16.7% of imports
- Japan: 15.6% of exports, 5.3% of imports
- European Union: 4.5% of exports, 15.3% of imports
- South Korea: 8.2% of exports, 4.4% of imports
- United States: 4.5% of exports, 10.8% of imports
- India: 5.6% of exports, 2.9% of imports
- New Zealand: 2.6% of exports, 2.1% of imports
Long-term trends in trade direction
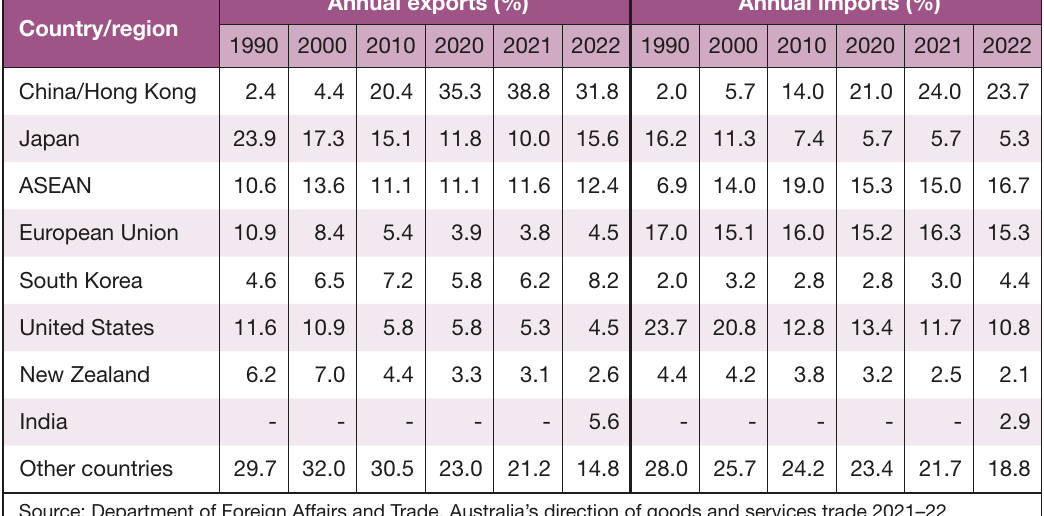
The table above demonstrates dramatic shifts in Australia's trade relationships between 1990 and 2022:
China/Hong Kong: Export share increased from just 2.4% in 1990 to 31.8% in 2022, while import share rose from 2.0% to 23.7%. This represents one of the most significant changes in Australia's trade history.
Japan: Export share declined from 23.9% in 1990 to 15.6% in 2022, while import share fell from 16.2% to 5.3%. This reflects Japan's economic stagnation and Australia's shift toward other markets.
ASEAN: Both export and import shares have remained relatively stable, though ASEAN has become increasingly important as Australia seeks to diversify away from over-reliance on China.
Analyzing Trade Shifts: The China-Japan Transition
Comparing 1990 to 2022:
- China's export share: 2.4% → 31.8% (increase of 29.4 percentage points)
- Japan's export share: 23.9% → 15.6% (decrease of 8.3 percentage points)
This remarkable shift occurred over just three decades and represents a complete reorientation of Australia's export markets. The combined effect means that while Japan was Australia's dominant export partner in 1990, by 2022 China had become more than twice as important.
United States and European Union: Both have declined as export destinations (USA from 11.6% to 4.5%; EU from 10.9% to 4.5%), though they remain important sources of imports, particularly for capital equipment and consumer goods.
India: Emerged as a notable trading partner by 2022 (5.6% of exports, 2.9% of imports), representing Australia's ongoing effort to diversify trade relationships.
Differences between export and import patterns
An important feature of Australia's trade is the difference between where it sells goods and where it buys them. While Australia does not export a high proportion to other advanced economies (especially the EU and USA), it still purchases substantial amounts from these regions.
Understanding Export-Import Asymmetry
Australia's trade pattern reveals its position in the global economy:
- Exports flow to: Rapidly industrializing Asian economies (particularly China) that need raw materials
- Imports flow from: Developed economies (EU, USA) that produce advanced technology and capital equipment
This pattern reflects Australia's role as a commodity supplier to Asia but a buyer of manufactured goods from developed economies.
This reflects:
- The importance of European and American capital equipment and technology
- Consumer demand for manufactured goods from these economies
- Australia's role as a commodity supplier to Asia but a buyer of manufactured goods from developed economies
Conversely, China and ASEAN economies serve as both major export destinations and large sources of imports. China's dual role reflects its demand for Australian commodities and Australia's demand for Chinese manufactured goods.
The changing composition of Australia's trade
Trends in export composition
Australia's export base has experienced significant structural change over recent decades, with minerals becoming increasingly dominant.
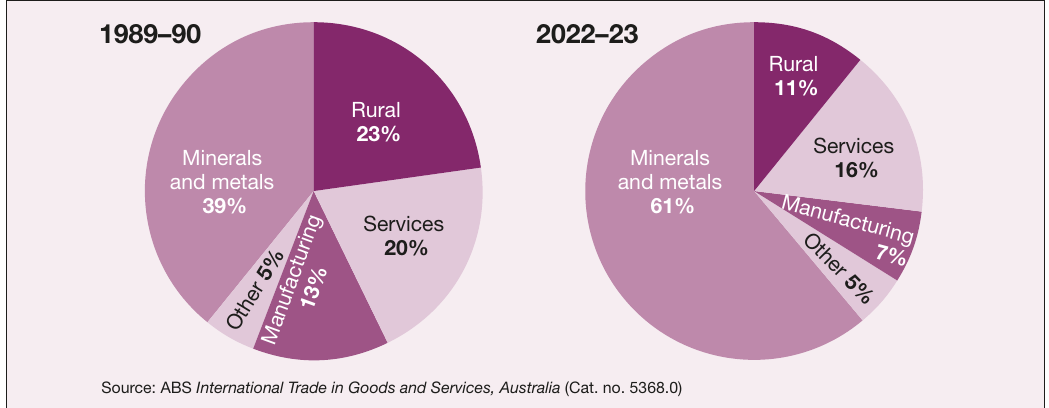
The pie charts above reveal a fundamental shift in Australia's export composition between 1989-90 and 2022-23:
Minerals and metals: Increased from 39% to 61% of total exports, reflecting Australia's comparative advantage in natural resources and strong global demand for commodities, particularly from China.
Rural products: Declined from 23% to 11% of total exports, despite Australia's strong agricultural sector. This relative decline stems from several factors:
- Large fluctuations in world agricultural prices
- Trade protection policies in other countries limiting market access
- Agricultural products generally having lower added value compared to manufactured goods
- Increasing frequency and severity of natural disasters (floods, bushfires) affecting agricultural output and productivity
Services: Declined from 20% to 16% of total exports, though this masks significant growth in absolute terms. Service exports include education, tourism, financial services, insurance, transport, health and communications services.
Manufacturing: Declined from 13% to 7% of total exports. Australia has struggled to compete in high-volume, low-cost manufacturing, though it has developed niche markets for sophisticated manufactured goods.
In 2022-23, Australia's total exports reached AUD $686 billion, up from AUD $595 billion in 2021-22. This increase reflected strong performance in metal ores and minerals exports (AUD $189 billion) and recovery in services exports (AUD $94 billion, up from AUD $61 billion in 2021-22).
Challenges and opportunities in Australia's export structure
Commodity Dependence Risks
Australia's heavy reliance on commodity exports, particularly to China, creates several vulnerabilities:
- Price volatility: Resource prices can fluctuate dramatically, creating uncertainty for export earnings
- Market concentration risk: Over-dependence on China as an export destination, particularly given recent instances of China imposing trade barriers on Australian exports
- Climate change impacts: Strong demand for coal and gas exports may decline as economies transition to lower-carbon energy sources. Australia risks being harder hit if carbon tariffs are adopted globally as part of climate change responses.
Diversification opportunities: Australia's long-term economic sustainability depends on diversifying both export products and markets:
New mineral and energy exports:
- Critical minerals: Australia possesses large reserves of minerals essential for clean energy technologies, including lithium, cobalt and rare earth elements
- Clean energy: Potential to export hydrogen and renewable energy (potentially via undersea cables)
Services expansion:
- Australia employs nearly three-quarters of its workforce in service industries
- Established markets exist for education services, financial services, insurance and tourism
- Growing middle-class populations across Asia create opportunities for Australian service exports
- Note: The COVID-19 pandemic severely impacted service exports, particularly tourism and education, though recovery is underway
The Services Export Opportunity
While minerals dominate Australia's export composition, the services sector represents a significant diversification opportunity. With Asia's middle class expected to grow substantially in coming decades, demand for Australian education, tourism, financial services, and professional services could provide a less volatile and more sustainable export base compared to commodity dependence.
Trends in import composition
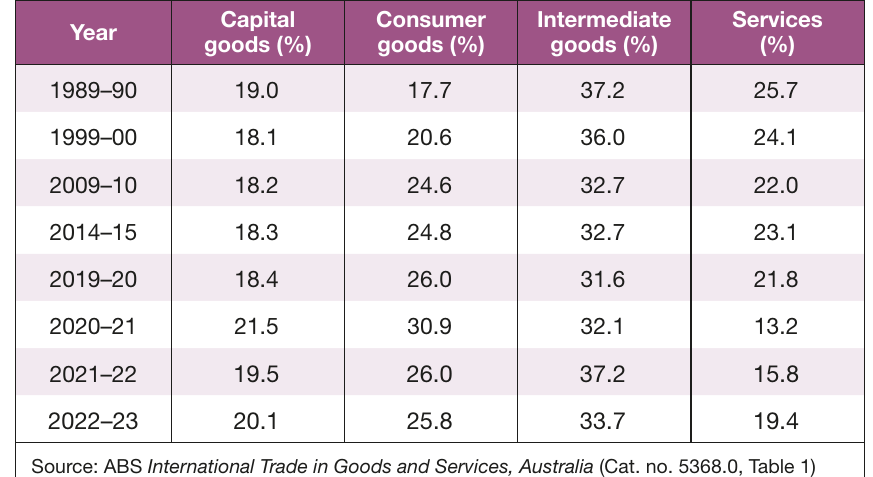
The table above shows moderate changes in Australia's import composition between 1989-90 and 2022-23:
Capital goods: Remained relatively stable at around 20% of imports (19.0% in 1989-90 to 20.1% in 2022-23). These are machinery, equipment and technology used for production.
Consumer goods: Increased from 17.7% to 25.8% of imports. This growth reflects:
- The shift away from domestic manufacturing in Australia
- Gradual reduction of tariffs and local content rules
- Increased consumer demand for imported products
Intermediate goods: Declined from 37.2% to 33.7% of imports. These are part-finished goods used in production processes. The decline reflects reduced manufacturing activity in Australia.
Services: Declined from 25.7% to 19.4% of imports. Note the significant drop during 2020-21 (to 13.2%) due to COVID-19 pandemic restrictions on international travel and services.
In 2022-23, Australia's total imports were valued at AUD $547 billion:
- Intermediate goods: AUD $190 billion
- Consumer goods: AUD $138 billion
- Capital goods: AUD $105 billion
- Services: made up the remainder
Key concepts and definitions
Small, open economy: An economy that represents a small proportion of the global economy but where trade is central to economic activity. Australia produces less than 2% of Gross World Product but exports over 25% of GDP.
Direction of trade: The geographic pattern of a country's exports and imports, showing which countries or regions are the main trading partners.
Composition of trade: The types of goods and services that make up a country's exports and imports (e.g., minerals, manufactures, services).
Merchandise trade: Trade in physical goods, excluding trade in services.
Comparative advantage: The ability to produce goods and services at a lower opportunity cost than other countries. Australia has comparative advantage in commodities due to abundant natural resources.
Primary commodities: Raw materials and agricultural products such as minerals, coal, iron ore, wheat and wool.
Capital goods: Machinery, equipment and technology used in the production of other goods and services.
Consumer goods: Products purchased by households for final consumption.
Intermediate goods: Part-finished goods and materials used as inputs in the production of other goods.
Exam focus: Analyzing trends
What Examiners Expect
When analyzing trends in Australia's trade patterns, examiners expect you to:
Identify and explain: Not just describe what changed, but explain why these changes occurred (e.g., China's growth, UK joining EU, Japan's stagnation).
Use data: Support your analysis with specific statistics from figures and tables. Compare different time periods to show the magnitude of change.
Link to economic concepts: Connect trends to concepts like comparative advantage, globalization, economic growth rates in different regions.
Evaluate implications: Consider both opportunities and risks arising from these trends. For example, China's dominance creates both export opportunities and concentration risk.
Consider future developments: Discuss potential future changes, such as the transition to clean energy affecting demand for fossil fuels, or the growth of India as a trading partner.
Sample Analysis: Export Composition Changes
When analyzing the shift from 39% to 61% minerals in exports:
- Identify the trend: Minerals increased by 22 percentage points over 33 years
- Explain the causes: China's rapid industrialization created massive demand for iron ore, coal, and other minerals
- Link to concepts: This reflects Australia's comparative advantage in natural resources
- Evaluate implications: While profitable, this creates vulnerability to commodity price fluctuations and China's economic cycles
- Future considerations: Transition to clean energy may reduce demand for fossil fuels but increase demand for critical minerals
Remember!
Key Points to Remember
-
Australia is a small, open economy: Trade is crucial (over 25% of GDP), but Australia has limited influence on global economic developments.
-
China dominates Australia's trade: Since 2007, China has been Australia's largest trading partner, accounting for over 30% of exports. This creates both opportunities and risks from market concentration.
-
The direction of trade has shifted dramatically: From UK/Europe (pre-1973) to Japan (1960s-1990s) to China (2000s-present). The 2020s are seeing diversification toward India and ASEAN economies.
-
Minerals dominate exports: The composition of exports shifted from 39% minerals in 1989-90 to 61% in 2022-23, while rural exports declined from 23% to 11%. This commodity dependence creates vulnerability to price volatility and climate change policies.
-
Future diversification is essential: Long-term sustainability requires diversifying toward critical minerals, clean energy exports (hydrogen), and services demanded by Asia's growing middle class, while reducing dependence on fossil fuel exports and a single major market.