Recent Unemployment Trends (HSC SSCE Economics): Revision Notes
Recent Unemployment Trends
Introduction: volatility in the modern labour market
Australia's labour market has experienced significant fluctuations in recent years, driven primarily by the COVID-19 pandemic. The pandemic triggered an initial surge in unemployment, followed by a dramatic recovery that produced the lowest unemployment rates seen in nearly half a century.
While some economies faced extreme disruption during the pandemic (the United States saw unemployment leap from 4% to 16%), Australia's swift and comprehensive policy response meant the impact on domestic unemployment remained relatively contained. This demonstrates how effective government intervention can moderate labour market shocks during economic crises.
Historical unemployment patterns
Understanding current trends requires examining Australia's unemployment history over several decades. The pattern reveals distinct periods shaped by different economic forces.
The shift from low to higher unemployment (1960s-1970s)
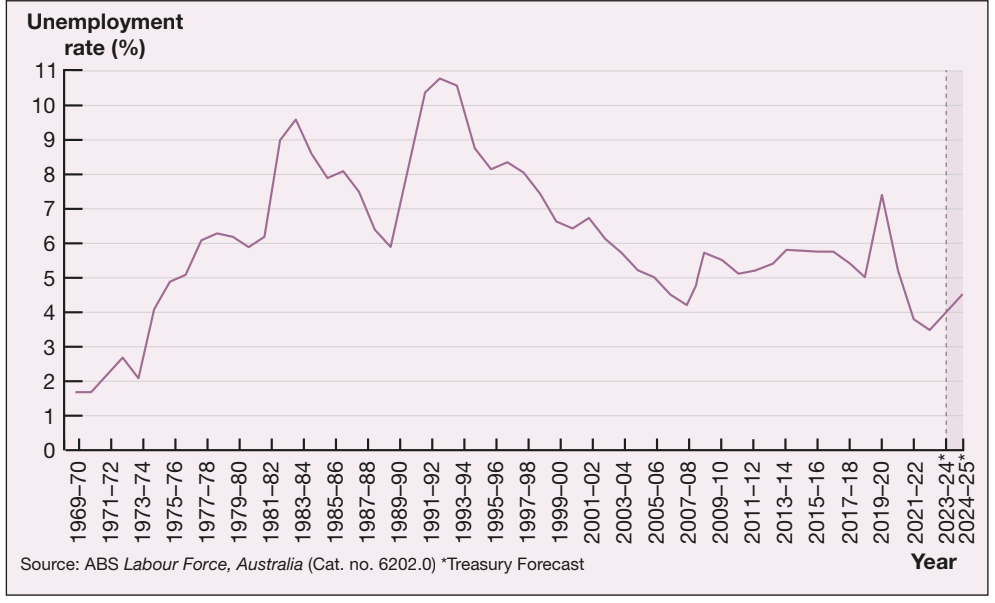
Throughout the 1960s and early 1970s, Australia maintained very low unemployment rates. This changed dramatically in the mid-1970s when unemployment began rising significantly, marking the end of the post-war full employment era.
The recession peak of the early 1990s
The most severe unemployment crisis in modern Australian history occurred in the early 1990s. The unemployment rate reached 10.7% in 1992-93, the highest level recorded since the Great Depression of the 1930s.
This dramatic increase stemmed from a severe recession that affected both Australia and the global economy. Falling aggregate demand (total spending in the economy) forced businesses to cut production and many firms closed entirely. This led to widespread job losses across multiple sectors.
The unemployment problem during this period was intensified by extensive structural change and microeconomic reform. Many workers who lost jobs in declining industries struggled to find employment in growing sectors because they lacked the required skills. As new technologies and production methods transformed business operations, unemployment increasingly became a structural rather than purely cyclical problem. Workers' existing skills no longer matched the demands of emerging industries, creating a persistent mismatch in the labour market.
Recovery and the global financial crisis (1993-2008)
From 1993 to 2008, Australia experienced a gradual but sustained reduction in unemployment. This 15-year downward trend reflected economic expansion and structural reforms that improved labour market flexibility.
However, the 2008 global financial crisis (GFC) triggered a worldwide recession. Australia's unemployment rose by almost 2 percentage points during 2008-09, but this increase was much milder than in most advanced economies. Strong economic growth resumed the following year, bringing unemployment back close to 5% by 2010.
This relatively mild impact demonstrated the resilience of Australia's economic management and policy frameworks. While other advanced economies experienced much more severe unemployment increases, Australia's policy response and economic fundamentals helped cushion the blow.
Stability in the 2010s
Throughout the 2010s, Australia's unemployment rate remained mostly between 5% and 6%. This positioned Australia just below the average for advanced economies, indicating relatively strong labour market performance compared to similar developed nations.
COVID-19 impact and remarkable recovery
The COVID-19 pandemic and associated lockdowns pushed unemployment to 7.4% in July 2020. While this represented the highest rate in over 20 years, it remained lower than the 1990s peak and significantly better than most other advanced economies experienced during the pandemic.
Australia's employment recovery proved remarkably swift. The employment rate returned to its pre-pandemic level in the first half of 2021, more than 18 months ahead of the OECD average. This rapid recovery reflected both the effectiveness of policy support measures (such as JobKeeper) and the economy's underlying resilience.
By mid-2023, the unemployment rate had fallen to 3.5%, approximately the lowest level since 1974. However, Reserve Bank forecasts indicated a mild upward trend in unemployment during 2024, suggesting the ultra-low rates might not be sustainable.
Underemployment and changing work patterns
Official unemployment statistics capture only one dimension of labour market challenges. Underemployment has emerged as an increasingly important concern in Australia's labour market.
Understanding underemployment
Underemployment occurs when people are employed but working fewer hours than they desire and are available for. Unlike unemployment (having no job), underemployment means having insufficient work. The official unemployment statistics do not fully reflect this problem, meaning they may understate the true extent of labour market underutilisation.
Growth in part-time employment
Australia's labour market has sustained faster growth in part-time than full-time jobs over recent decades. This shift represents a fundamental change in employment patterns, with implications for workers' incomes, job security, and career development.
By 2023, approximately 30% of employed Australians worked in part-time jobs, averaging around 17 hours per week. Around one in five part-time workers wanted to work longer hours, indicating significant hidden slack in the labour market.
Recent underemployment trends
Underemployment increased sharply during the COVID-19 pandemic, reaching a record high of 13.7% in 2020 (representing 1.8 million people). As economic activity recovered, underemployment fell back to lower levels, reaching 6.4% by mid-2023.
While Australia has lower unemployment than most similar OECD economies, it has a higher rate of underemployment. This suggests that job quality and hours of work represent ongoing challenges, even when headline unemployment figures appear favourable.
The relationship between economic growth and unemployment
Okun's Law explained
Okun's Law provides a framework for understanding how economic growth relates to unemployment changes. The law establishes a critical relationship between these two key economic indicators.
Okun's Law states: To reduce unemployment, the annual rate of economic growth must exceed the sum of percentage growth in productivity plus the increase in the size of the labour force in any one year.
Worked Example: Applying Okun's Law
Consider an economy where:
- Productivity grows by 1.5%
- Labour force expands by 1.5%
To determine the GDP growth needed to reduce unemployment:
Step 1: Calculate the threshold growth rate
Step 2: Substitute the values
Step 3: Interpret the results
- Growth below 3%: unemployment will rise
- Growth at 3%: unemployment will remain stable
- Growth above 3%: unemployment will fall
Therefore, this economy needs GDP growth exceeding 3% to make progress on reducing unemployment.
Analysis by the Reserve Bank in 2015 found that the rate of GDP growth consistent with stable unemployment had fallen from around 5% in the 1970s to 2.9% by 2015. This decline reflected slower productivity growth and labour force expansion over time.
The productivity-unemployment trade-off
One important implication of Okun's Law is that in the short term, higher productivity growth actually makes reducing unemployment more difficult. When businesses can produce more output with the same number of workers, they need to hire fewer people to meet demand.
Australia experienced this during the 1990s, when higher productivity growth rates coincided with persistent unemployment problems. Workers were becoming more efficient, so businesses needed fewer employees to maintain or increase production.
Conversely, periods of lower productivity growth often see lower unemployment in the short term, as Australia experienced during the 2000s. When productivity growth slows, employers must hire more workers if they want to increase production, because they cannot rely as much on efficiency gains.
Short-term vs. Long-term Trade-off:
This trade-off only applies in the short term. Over the long run, higher productivity growth should lead to stronger economic growth and more job creation, as more efficient businesses can expand and compete more effectively. The short-term pain of slower job growth during productivity booms ultimately yields long-term gains through stronger economic performance.
Future labour market trends
Declining labour force participation
Australia's labour force participation rate (the percentage of the working-age population either employed or actively seeking work) is expected to decline gradually over coming decades. According to the Treasury's 2023 Intergenerational Report, participation is projected to fall from a peak of 66.9% in May 2023 to 63.8% by 2062-63.
The ageing population impact
This expected decline stems primarily from Australia's ageing population structure. Longer life expectancy and lower fertility rates mean a growing proportion of Australians are aged over 65 and typically not participating in the labour force.
In 2021, 17.2% of Australia's population was aged over 65 years, compared to just 12.2% before the turn of the century. The ABS forecasts this will grow to 18.1% by 2030 (over 5.4 million Australians). As this demographic shift continues, a larger share of the population will move into retirement, reducing overall participation.
Offsetting factors
The expected fall in participation caused by the ageing population will be partially offset by continued increases in women's labour force participation across all age groups. Female participation has risen significantly over recent decades and is expected to continue growing, particularly among middle-aged and older women.
Other factors that may influence participation rates include:
- Technological change, such as remote working arrangements that make employment more accessible
- The continued shift toward a service-based economy, which may create different employment opportunities
- Changes to the occupational structure of the workforce, with some jobs disappearing and new roles emerging
- Potential policy changes affecting retirement ages or incentives to work
Remember!
Key Points to Remember:
-
Australia's unemployment rate has shown exceptional volatility recently, spiking to 7.4% during COVID-19 (July 2020) before falling to 3.5% by mid-2023, near its lowest level since 1974
-
The worst unemployment crisis in modern history occurred in 1992-93 (10.7%), driven by recession and structural change that created skills mismatches between workers and available jobs
-
Underemployment is a growing concern alongside headline unemployment, peaking at 13.7% in 2020 and remaining at 6.4% in 2023, with many part-time workers wanting additional hours
-
Okun's Law explains that economic growth must exceed the combined rates of productivity growth and labour force expansion to reduce unemployment; Australia needs growth above 3% to make progress on unemployment reduction
-
Australia's labour force participation rate is projected to decline from 66.9% (2023) to 63.8% (2062-63) due to population ageing, though rising female participation will partially offset this trend