Comparing Economies (HSC SSCE Economics): Revision Notes
Comparing Economies
Introduction to economic comparisons
To understand how the Australian economy operates and performs, we need to compare it with other economies. Traditionally, Australia has been compared with advanced industrialised economies in Europe, North America and Japan (OECD members). However, it is increasingly important to analyse Australia within the Asian economic region.
The shift from traditional Western comparisons to regional Asian context represents a fundamental change in how we understand Australia's economic position and relationships in the global economy.
Why compare Australia with Asian economies?
There are several key reasons for comparing Australia with its regional neighbours:
Trade relationships: Over two-thirds of Australia's exports go to China, Japan, ASEAN nations and South Korea. This means Australia's economic performance is closely linked to these trading partners.
Economic resilience: Australia's continued growth during the late 2000s global financial crisis showed that its fortunes are more closely tied to Asian economies than to Europe or North America. When China and India maintained strong growth, Australia benefited.
Rising living standards: Many Asian economies have shifted towards market-oriented systems and experienced rising living standards in recent decades. This makes comparisons more meaningful and relevant for analysis.
Diversity of Asian economies
Asia is home to an extremely diverse group of economies. The region includes:
- Large, powerful economies: China and Japan
- Small island economies: Tonga and Vanuatu
- Wealthy economies: South Korea, Singapore, Hong Kong
- Less-developed economies: Timor-Leste
- Fast-growing economies: India
- Slow-growing economies: Japan
- Former centrally planned economies: Vietnam, China
- Pro-market economies: Singapore, Hong Kong
This diversity means there is no single "typical" Asian economy. Australia is more similar to some Asian economies on certain indicators and to others on different measures.
Framework for comparison
This note compares Australia with other Asian economies across five key areas:
- Economic growth and quality of life
- Employment and unemployment
- Distribution of income
- Environmental sustainability
- The role of government in health care, education and social welfare
For comparison purposes, Asian economies are grouped into three categories:
- Advanced economies: Japan, Australia, New Zealand
- Newly industrialised economies (NIEs): South Korea, Singapore, Hong Kong, Taiwan
- Emerging and Developing Asia: China, India, Indonesia, Vietnam, and others
Economic growth and quality of life
Economic size and the G20
By world standards, Australia is a middle-sized economy with a relatively small population of just 25 million people. The economy sits just outside the world's top 10 when measured by Gross Domestic Product (GDP). However, within the Asian economic region, Australia is more significant as the fifth-largest economy.
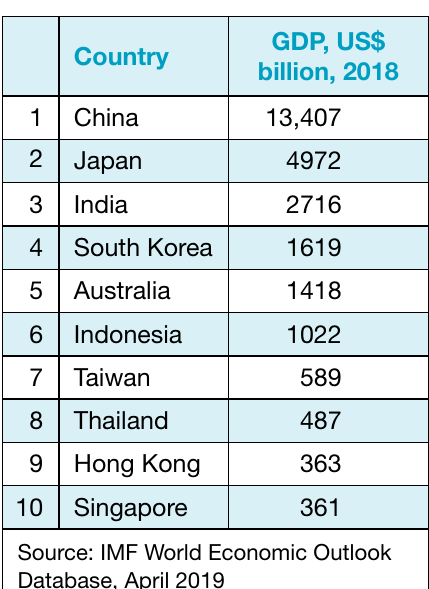
Asia's two largest economies are China and Japan, followed by four middle-sized economies: India, Australia, Korea and Indonesia. All six of these economies are members of the Group of 20 (G20), which brings together the world's largest and most important economies. The G20 is more representative than the older G7 group, which includes only one Asian economy (Japan).
Growth trends across the region
The Asian economic region has been the world's fastest-growing economic region since the Second World War. Economic development occurred in distinct phases:
First wave (1950s-1960s): Japan achieved rapid industrialisation following post-war reconstruction.
Second wave (1970s-1980s): The Asian "tiger" economies (South Korea, Singapore, Hong Kong and Taiwan) achieved rapid growth. These newly industrialised economies pursued export-oriented growth strategies, relying on competitive labour costs and growing export markets for manufactured goods. They achieved in just two decades what took European economies centuries.
Third wave (recent decades): Emerging and Developing Asian economies, including China, Indonesia and India, have experienced the fastest growth. These economies have averaged 7.6% annual economic growth over the past three decades. The newly industrialised economies averaged 5.5% over the same period, while Japan has slowed to just 1.7% per year.
Key Principle: During industrialisation, economies experience very rapid growth, but once industrialisation is complete, growth rates slow down.
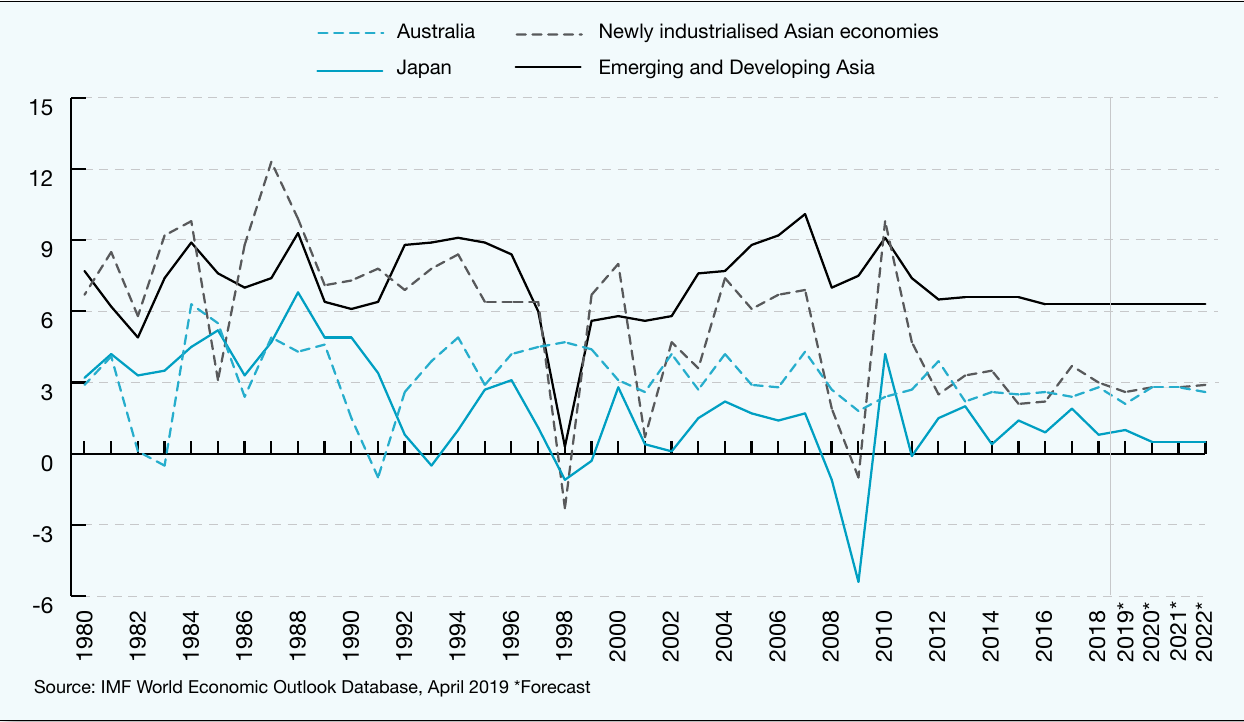
Understanding convergence
Convergence occurs when less-developed economies grow faster to "catch up" to the development levels of wealthier countries. Figure 3.2 shows convergence in action, with Emerging and Developing Asia experiencing strong, consistent growth while more developed economies grow more slowly.
The chart also reveals the impact of two major economic crises:
- Asian financial crisis (late 1990s): Had severe impacts across the region
- Global financial crisis (late 2000s): Affected Japan and newly industrialised economies more than large developing economies like China and India
Australia's growth performance
Australia's economic growth trajectory has been very different from most Asian economies. Because Australia achieved industrialisation and high living standards before the Second World War, it has not experienced the rapid growth seen in other regional economies.
Australia's average annual economic growth of 3.2% over the past three decades is:
- Slower than most economies in Asia
- Faster than most advanced economies around the world
After severe downturns in the early 1980s and early 1990s, Australia has achieved relatively stable economic growth. Australia's continued growth during both the Asian financial crisis and the global financial crisis highlighted how Australia's economic fortunes are increasingly linked to China and India rather than Europe or North America.
Living standards and GDP per capita
While economic size and growth tell us about total output, they do not reveal how individuals in different countries compare. For this, we examine living standards.
GDP per capita is a measure of living standards that takes the financial value of all goods and services produced by a nation in a year and divides this by the total population.
According to this measure, Australia has the second-highest standard of living in the Asia region at US$49,961, behind only Singapore (US$52,961) and ahead of Hong Kong (US$43,681), New Zealand (US$39,427) and Japan (US$38,894).
Individuals in these economies have living standards that are, on average, eight or nine times higher than the average citizen in other Emerging and Developing Asia economies, where GDP per capita is US$6,586 per year.
Quality of life
Quality of life is a measure of welfare based on more than just economic output per capita. Other factors include the quality of health care, educational opportunities and climate.
The Human Development Index (HDI) is a measure of economic development devised by the United Nations Development Program. It takes into account life expectancy at birth, levels of educational attainment and material living standards (as measured by Gross National Income per capita).
The HDI ranked Australia third in the world, behind only Norway and Switzerland, and ahead of all economies in Asia.
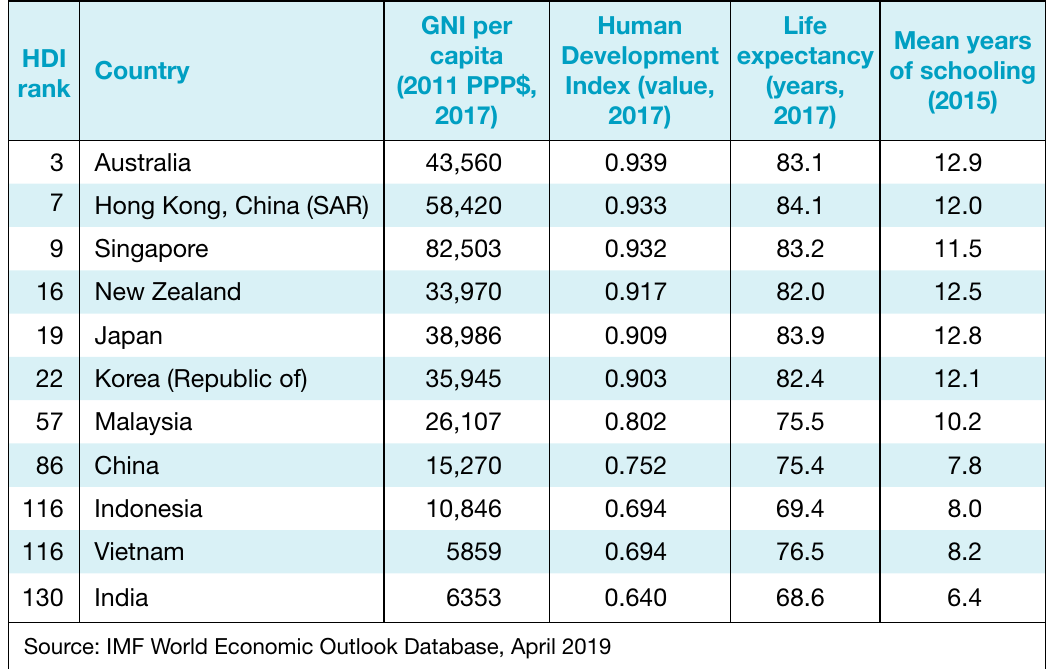
Other economies with relatively high levels of development are those with higher living standards: New Zealand, Japan, South Korea and Singapore.
Beyond statistics
Some aspects of quality of life cannot be easily measured by statistics alone. Australia's high quality of life extends to favourable social conditions:
- Climate: Temperate and generally pleasant
- Lifestyle: Relaxed and enviable
- Cultural diversity: One-quarter of the population born overseas
- Political and religious freedoms: Compare favourably with many Asian countries
- Liveable cities: Sydney and Melbourne consistently rated amongst the most desirable cities in the world
Employment and unemployment
Unemployment rate comparisons
Australia's unemployment rate of 5.2% in mid-2019 was above most economies in Asia. While official unemployment rates were similar in Indonesia and the Philippines, they were lower in:
- The fast-growing Chinese economy
- Japan
- Korea
- Singapore
- Thailand
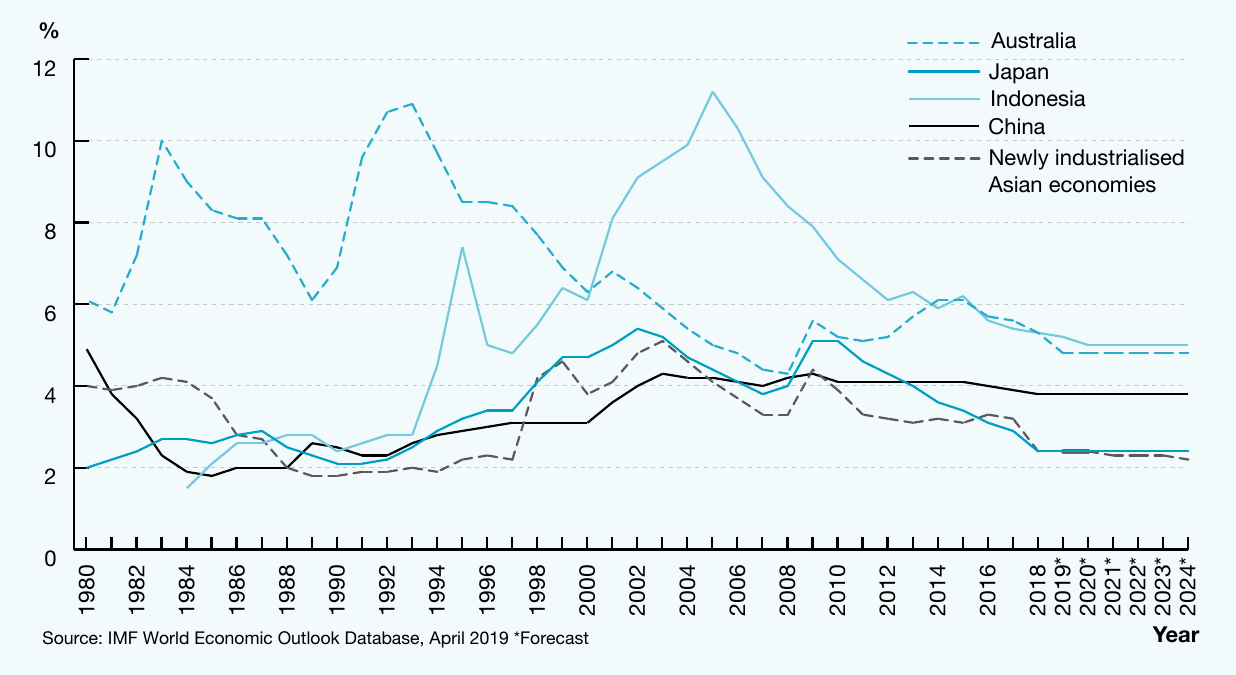
The chart reveals different unemployment trends across Asian economies:
- General upward trend: China and Japan have experienced rising unemployment
- Declining trend: Australia has experienced falling unemployment since the early 1990s (after much higher unemployment during the 1980s and early 1990s)
- Post-crisis increase: Indonesia's unemployment increased following the Asian financial crisis of the late 1990s but has fallen in recent years
Employment patterns
Employment patterns in Australia are similar to those of most advanced economies:
- Services industries: The majority of people are employed in services such as retail trade, real estate and business services
- Manufacturing and construction: Continue to provide substantial jobs
- Agriculture: Much smaller than in previous decades (less than 5% of jobs)
These patterns are similar in Japan, which also has less than 5% of jobs in agriculture and almost three-quarters of the labour force employed in services.
Many Asian economies still undergoing industrialisation have different employment patterns:
- Smaller service sectors: Services employ a lower proportion of workers
- Large agricultural sectors: For example, Indonesia has 41% of its labour force in farming and fishing
In coming decades, mass urbanisation is likely to continue across many Asian economies, with substantial numbers of people moving from rural to urban centres to seek work in industry and services sectors.
Distribution of income
Understanding income inequality
How income is distributed in an economy is very important. Even if an economy has high average GDP per capita, if income is concentrated among a small group, others may suffer from very low living standards.
Several factors affect income distribution:
Pure market economies tend to have unequal income distribution because those with ownership of resources and greater skills receive larger income rewards.
Agricultural developing economies can also have very unequal distribution because of divisions between rural and urban populations and concentration of land ownership among wealthier groups.
Industrialisation process can worsen inequality as one part of society becomes much wealthier while others gain little or become worse off.
Mixed economies with greater government roles in redistributing income tend to be more equal.
Measuring inequality with the Gini Index
The Gini Index is a measure of inequality that is a number between 0 and 100, with lower numbers indicating a more equal distribution of income.
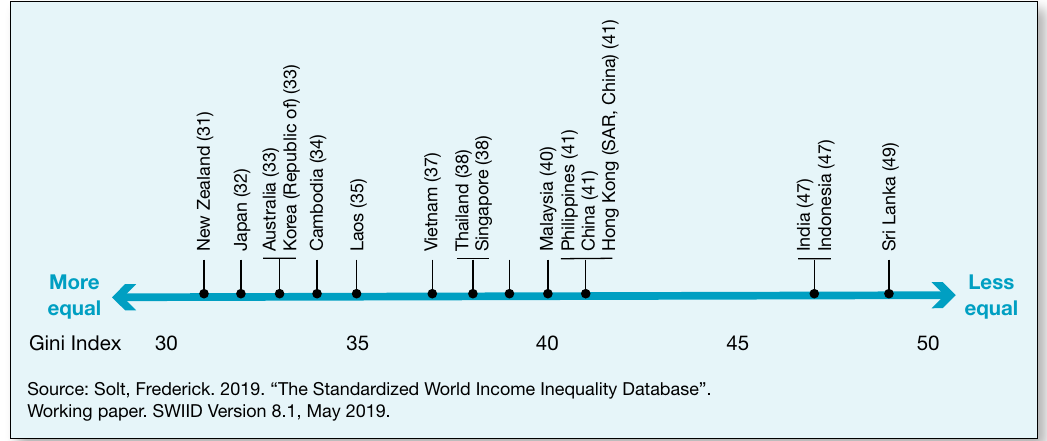
In general, Asian economies have greater inequality than developed European economies. Key patterns include:
More equal societies (lower Gini Index):
- Japan (32)
- Australia (33)
- New Zealand (31)
- Korea (33)
These industrialised economies have relatively equal income distribution.
More unequal societies (higher Gini Index):
- Singapore (38)
- Hong Kong (41)
- China (41)
- India (47)
- Indonesia (47)
- Sri Lanka (49)
Fiercely pro-market economies like Singapore and Hong Kong have only a small government role in redistributing income, resulting in more skewed distribution. Other economies like China and India are relatively unequal, particularly due to gaps between poorer rural areas and wealthier urban areas.
Environmental sustainability
Australia's environmental position
Over recent decades, environmental sustainability has become increasingly important in economic decision-making. Australians often think of their country as having superior environmental qualities compared with other regional economies. In several respects, this is true—Australia has a much cleaner environment than China, which has experienced:
- Severe air pollution
- Poisoned river systems
- Widespread health problems from pollution and toxic chemicals
However, for an industrialised country, Australia's environmental sustainability is still relatively poor in several areas.
Biodiversity preservation
Australia has a very poor record of preserving biodiversity despite being one of only 17 "megadiverse" nations in the world and home to more species than any other developed country.
Key facts:
- Over 50 birds and mammals have become extinct in Australia in the past two centuries
- Australia has been responsible for one-third of all species extinctions worldwide during that period
- A further 1,700 animals and plants are listed as being at risk of extinction
Water resources
Australia makes relatively good use of its water resources, measured by water productivity (US dollars of economic output per cubic metre of freshwater used).
According to World Bank estimates, Australia's water productivity is:
- Australia: US$78 per cubic metre
- Korea: US$31 per cubic metre
- New Zealand: US$28 per cubic metre
- East Asia & Pacific average: US$17 per cubic metre
Climate change
The most significant environmental issue facing Australia and Asia is climate change (also known as global warming), related to emission of greenhouse gases:
- Carbon dioxide ()
- Nitrous oxide (NO)
- Methane ()
Evidence of climate change:
- Eighteen of the 19 warmest years on record have occurred since 2001
- 2016 was the hottest year on record (according to US National Oceanic and Atmospheric Administration)
- Arctic ice thickness has decreased 40% since the 1960s
- Extreme weather events occurring with greater frequency
Potential consequences:
The UN Intergovernmental Panel on Climate Change estimates increased greenhouse gas emissions could lead to global temperatures rising by 1.0 to 5.4 degrees Celsius this century unless action is taken. This could result in:
- Rising sea levels
- More severe and unpredictable weather events
- Threats to global economic growth
- Food security issues
- Human health impacts
Some Asian economies are particularly vulnerable because of extensive low-lying coastal areas and frequent extreme weather events.
The Paris Agreement
At the 2015 UNFCCC in Paris, a historic agreement was negotiated with representatives from nearly 200 countries to keep "the increase in global average temperature to well below 2°C above pre-industrial levels"—the benchmark scientists believe necessary to prevent the most dangerous impacts of climate change.
The agreement, effective from November 2016, was significant because:
- For the first time, it included developing nations like China and India
- It included the United States (though the US later took steps to withdraw under the Trump administration)
- It has greater transparency and review mechanisms than the Kyoto Protocol
- As of 2019, 196 countries were signatories and 183 had ratified it (including Australia)
Australia's carbon emissions
Australia is implementing domestic policies to reduce greenhouse gas emissions, with the ultimate goal of reducing carbon emissions to 26-28% below 2005 levels by 2030.
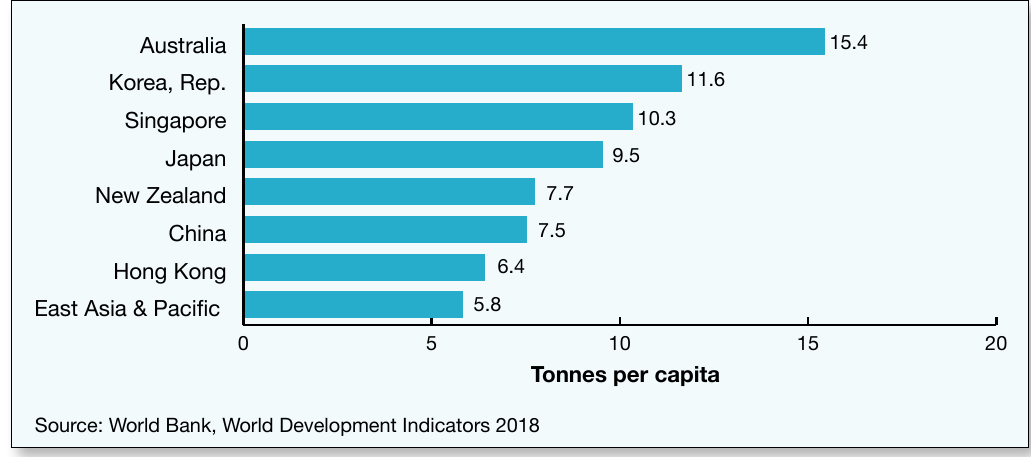
One argument for Australia reducing emissions is that our emissions per person (almost 17 tonnes of carbon dioxide) are among the highest in the world:
- Around 50% more than Japan and Korea
- More than 70% above the average in advanced economies
The system of carbon pricing introduced in 2012 was abolished in 2014 and replaced by "Direct Action" initiatives, including an Emissions Reduction Fund providing grants to businesses for projects that lower carbon emissions.
Regional environmental challenges
All Asian economies face unique environmental problems:
- Indonesia: Significant contributor to climate change through forest destruction
- China: Emissions will have major impact on world climate
- India: Some of the world's most polluted cities due to poor urban planning and outdated infrastructure
- Small island economies: Polluting oceans through industrial waste and sea litter
Both domestic policies and greater global cooperation will be required to address these environmental issues.
The role of government
Market economies vs planned economies
A major question facing any society is the extent to which government should be involved in economic activity. Governments can be involved through:
Direct involvement:
- Operating government-owned businesses
- Setting price levels
- Imposing rules and regulations
Indirect involvement:
- Taxes
- Subsidies
- Other measures to encourage resource movement between sectors
Service provision:
- Health care
- Education
- Social welfare
Historical divisions in Asia
For most of the second half of the twentieth century, the role of government in Asian economies was shaped by whether they were market economies or planned economies:
Market economies (concentrated in East Asia):
- Japan
- Korea
- Singapore
- Indonesia
Planned economies (concentrated on the Asian continent):
- China
- Vietnam
- India
- Cambodia
Over the past three decades, these divisions have become less significant. Planned economies like China and Vietnam have reduced government control, allowing market forces of supply and demand to play greater roles. Market economies have used various interventions to promote competitive export sectors and rapid industrialisation.
Australia's economic system
Australia's economic system has always had more in common with the market economies of East Asia. During the Cold War, Australia was firmly allied with capitalist countries like Japan and Korea.
Key features of Australia's economy:
- Primarily market-driven: Especially in agriculture, mining, construction and manufacturing
- Mixed economy: Government role in telecommunications, aviation, banking and insurance
- Reduced government role: Recent decades have seen deregulation and privatisation of government-owned businesses
Measuring government intervention
The Index of Economic Freedom, compiled by the Heritage Foundation, uses 10 indicators to assess government intervention, including:
- Private property rights
- Government regulation
- Spending on welfare and other services
The 2019 index rated Australia as the fifth "freest" economy in the world, behind Hong Kong, Singapore and New Zealand, but ahead of Japan and South Korea.
Another comparison method examines the percentage of GDP spent by government and collected in taxation:
- Australia: 37% of GDP (2018)
- Japan: 37% of GDP
- ASEAN-5 average: 20% of GDP
- Emerging and Developing Asia: 29% of GDP
Compared with most Asian economies with lower living standards, Australians pay more in tax and receive more benefits and services from their government.
Health care provision
Australia has a well-established system of universal health care known as Medicare. This contrasts with most developing economies in Asia, whose public health systems are relatively undeveloped and where some rely on private health care.
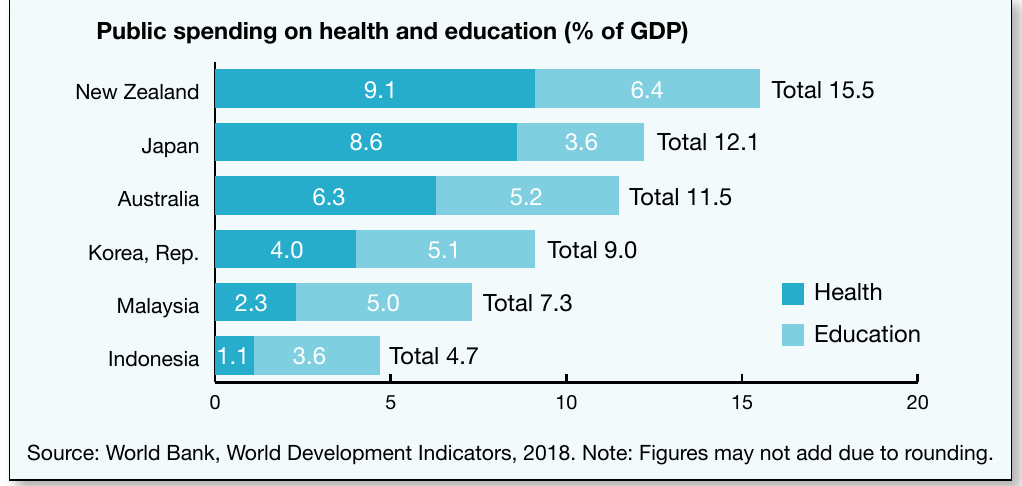
Public spending on health care in Australia is just over 6% of GDP, which is high compared with most Asian economies. Australia's belief in a strong government role in health care is shared by most industrialised economies, including Japan. However, there has been greater emphasis on privately funded health care in Australia in recent years.
Health challenges in Asia:
Many developing economies struggle with:
- Diseases of poverty: Caused by poor water and sanitation
- Lifestyle diseases: Obesity, diabetes, cardiovascular diseases (associated with greater prosperity)
- Respiratory diseases: Due to high smoking rates (e.g., around 50% in China, Korea, Vietnam; 70% in Indonesia, compared with 17% in Australia)
Education systems
At primary and secondary levels, there is universal free education in Australia, as in most other advanced economies. Around one-third of Australian students attend private schools. The government provides most educational services, and the vast majority of universities are public.
Australian university students pay a substantial share of their education costs, though payment can be deferred under the Higher Education Contribution Scheme (HECS), which allows students to defer payment until they find employment.
Education in Asia:
Many Asian economies have similar basic features:
- Compulsory primary schooling, mostly government-run and funded
- Voluntary high school years with increasing private funding
- High cultural value placed on education
International surveys of maths and science education suggest systems are particularly strong in Singapore, Korea, Japan and other East Asian countries.
Government funding:
Australia's government funding of education (around 5% of GDP) is above average compared with Asian nations. For some countries, lower government spending reflects greater reliance on private contributions. In developing countries, it simply reflects competition for scarce government resources and more basic education challenges, including raising literacy and extending education to rural populations.
Social welfare
Australia's social welfare system provides much greater assistance than most Asian countries. The purpose is to ensure a minimum standard of living for people unable to work or looking for work.
Welfare benefits include:
- Unemployment benefits
- Age pension
- Disability support payments
- Family payments
- Paid maternity leave
Pension spending comparisons:
Australia's public expenditure on elderly and disabled pensions is high by regional standards:
- Australia: 4.2% of GDP
- Japan: 9.4% of GDP (reflecting older population and greater reliance on public pensions)
- Korea: 3.0% of GDP
- Indonesia: 0.8% of GDP
- India: 1.3% of GDP
Future trends:
As more Asian economies become industrialised, demands for social welfare are likely to increase. By contrast, the trend in Australia is towards restricting social welfare by tightening eligibility:
- Almost all payments subject to "means tests" (limiting benefits for people with other income or assets)
- Unemployment benefits tied to "Work for the Dole" and job-seeking requirements
- Superannuation increasingly funding retirement needs
With an ageing population, Australia faces growing pressures to sustain its social welfare system in coming decades without raising taxes while ensuring adequate resources for other priorities like health care, education and infrastructure.
Key Points to Remember:
-
Australia's economy is best understood in its regional Asian context rather than just compared with traditional Western partners, given that over two-thirds of exports go to Asian economies.
-
Asian economies are extremely diverse, ranging from large powerful economies like China and Japan to small island nations, and from wealthy nations like Singapore to developing economies like Timor-Leste.
-
Economic growth patterns show convergence, with Emerging and Developing Asia experiencing rapid growth (7.6% average) while more developed economies grow more slowly, as industrialisation drives rapid growth that later moderates.
-
Australia ranks highly on quality of life measures (3rd globally on HDI) with strong living standards (US$49,961 GDP per capita), but performs poorly on some environmental sustainability measures, particularly carbon emissions per capita (17 tonnes).
-
Government's role in the economy varies significantly across Asia, with Australia spending 37% of GDP on government services (similar to Japan), providing extensive health care, education and social welfare compared with most regional neighbours.