Real-World Examples (HSC SSCE Mathematics Standard): Revision Notes
Real-World Examples
Introduction
Rates are powerful mathematical tools that help us understand and compare real-world situations. By learning to calculate and interpret rates, you can make better decisions about your health, finances, and everyday choices.
Rates are essential in everyday life, helping us make informed decisions about health monitoring, vehicle efficiency, and other practical matters. This note explores real-world applications of rates including fuel consumption, heart rate monitoring, blood pressure measurement, and blood type distributions.
Fuel consumption
What is fuel consumption?
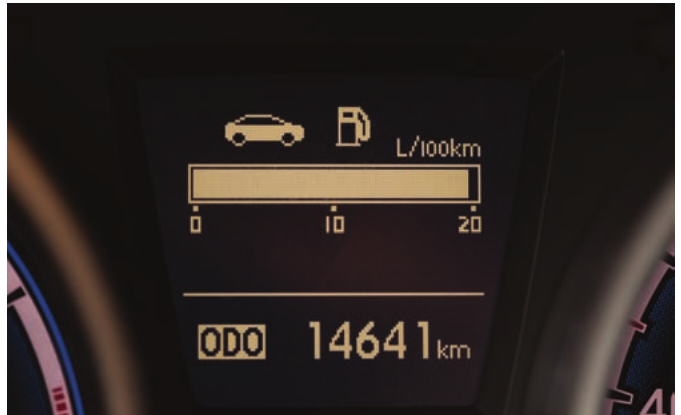
Fuel consumption measures how efficiently a vehicle uses petrol or diesel. It tells us how many litres of fuel a vehicle uses to travel 100 kilometres. This measurement helps you compare different vehicles and understand running costs.
To calculate fuel consumption, you need to:
- Fill your vehicle's tank completely
- Note the odometer reading (distance travelled shown on the dashboard)
- Drive until you need to refuel
- Note the new odometer reading
- Record how many litres it takes to refill the tank
- Calculate the distance travelled (difference between the two odometer readings)
Fuel consumption formula
The formula for calculating fuel consumption is:
The result is expressed in litres per 100 kilometres, written as L/100km. A lower fuel consumption value means better fuel efficiency and lower running costs.
Lower is Better!
Remember: A lower fuel consumption value means better fuel efficiency and lower running costs. For example, 6.5 L/100km is more efficient than 9.2 L/100km.
Worked example: Calculating fuel consumption
Worked Example: Calculating Fuel Consumption
Let's calculate the fuel consumption for two different vehicles.
Part a: Medium-sized car
A medium-sized car travelled 850 km using 78.2 L of petrol. What was the fuel consumption?
Solution:
Step 1: Write the formula
Step 2: Substitute the values (78.2 L and 850 km)
Step 3: Calculate
Therefore, the fuel consumption is 9.2 litres per 100 kilometres.
Part b: Small-sized car
A small-sized car travelled 260 km using 16.9 L of petrol. What was the fuel consumption?
Solution:
Step 1: Write the formula
Step 2: Substitute the values (16.9 L and 260 km)
Step 3: Calculate
Therefore, the fuel consumption is 6.5 litres per 100 kilometres.
Comparison: The small car is more fuel-efficient, using 6.5 L/100km compared to the medium car's 9.2 L/100km.
Heart rate
Understanding heart rate
Heart rate is the number of times your heart beats per minute, measured in beats per minute (bpm). Understanding your heart rate helps you monitor fitness levels and exercise safely.

You can measure heart rate by:
- Manual method: Press your index and middle fingers on your wrist or neck where you can feel your pulse, then count beats for 60 seconds (or count for 15 seconds and multiply by 4)
- Heart rate monitor: A chest strap with electrodes sends data to a wrist receiver, useful during exercise when manual measurement is difficult
- Electrocardiograph: Medical professionals use this device for accurate heart rate measurement to diagnose and track medical conditions
Understanding Resting Heart Rate
Resting heart rate is measured when you are at rest but awake. For most people, resting heart rate is typically between 60 and 80 bpm. Athletes often have lower resting heart rates due to better cardiovascular fitness, sometimes as low as 40-50 bpm.
Maximum heart rate (MHR)
Maximum heart rate estimates the highest safe heart rate during intense exercise. The most widely used formula is:
This simple formula provides an estimate based on your age. As you get older, your maximum heart rate decreases.
Worked Example: Estimating Maximum Heart Rate
Estimate the maximum heart rate for an 18-year-old.
Solution:
Step 1: Write the formula
Step 2: Substitute 18 for age
Step 3: Calculate
Therefore, the maximum heart rate for an 18-year-old is estimated to be 202 bpm.
Interpreting resting heart rate tables
The following table shows average resting heart rates for men across different age groups and fitness levels:
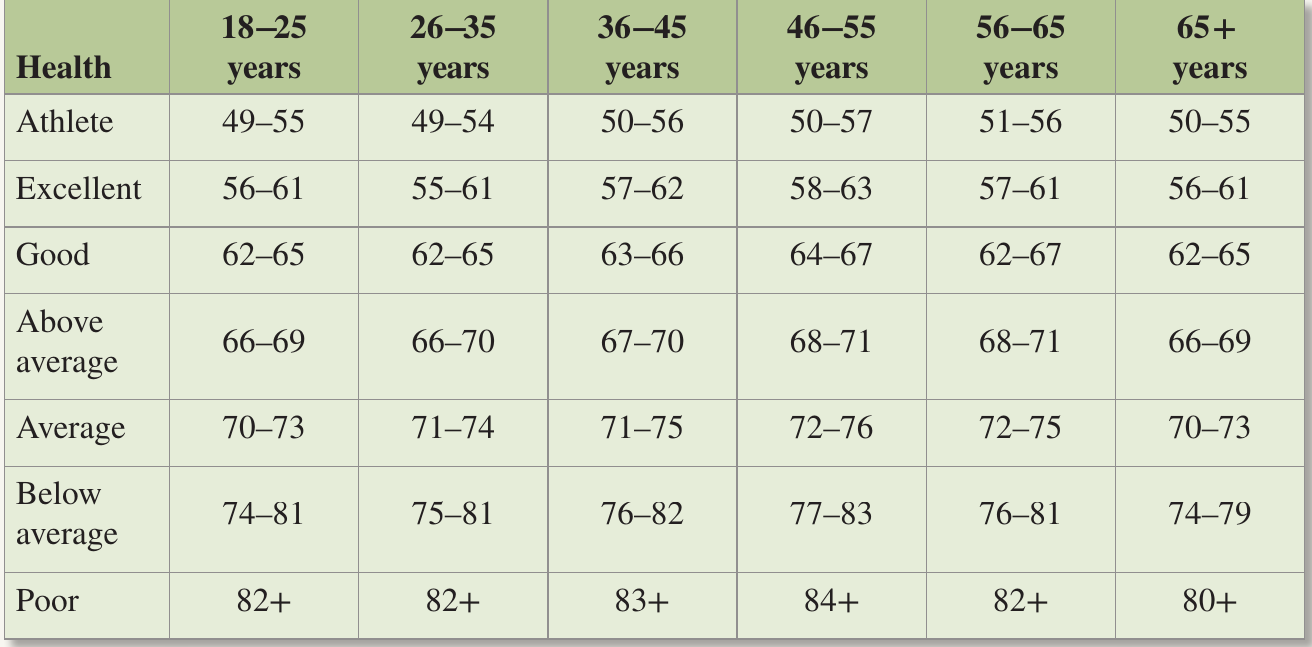
The table is organised with:
- Age groups across the top (18-25 years through to 65+ years)
- Health categories down the left side (from Athlete to Poor)
- Heart rate ranges in the cells (in bpm)
Key observations:
- Athletes have the lowest resting heart rates (49-60 bpm range)
- Poor fitness levels show the highest rates (80+ bpm)
- Heart rate ranges increase slightly with age within each fitness category
Worked Example: Interpreting Heart Rate Trends
Using the resting heart rate table for men, answer the following questions:
Part a: What is the average resting heart rate for a man aged 47 years in good health?
Solution:
Step 1: Locate the age column - Age 47 falls in the range 46-55 years
Step 2: Locate the "Good" health row and read the value at the intersection
Therefore, the average resting heart rate is 64-67 bpm.
Part b: What is the average resting heart rate for a man aged 25 years in below-average health?
Solution:
Step 1: Locate the age column - Age 25 falls in the range 18-25 years
Step 2: Locate the "Below average" health row and read the value at the intersection
Therefore, the average resting heart rate is 74-81 bpm.
Part c: What is the health of a man aged 57 years with a resting heart rate of 60?
Solution:
Step 1: Locate the age column - Age 57 falls in the range 56-65 years
Step 2: In that column, locate the heart rate 60, which falls in the range 57-61
Step 3: Read the row header: Excellent
Therefore, his health is classified as excellent.
Part d: What is the health of a man aged 30 years with a resting heart rate of 84?
Solution:
Step 1: Locate the age column - Age 30 falls in the range 26-35 years
Step 2: In that column, locate the heart rate 84, which falls in the range 82+
Step 3: Read the row header: Poor
Therefore, his health is classified as poor.
Target heart rate (THR)
Target heart rate is the ideal heart rate range during exercise that provides the most benefit to your heart and lungs. This range depends on several factors including age, physical condition, gender and previous training.
The THR is calculated as a range between 65% and 85% of your maximum heart rate:
Worked Example: Calculating Target Heart Rate
For an 18-year-old with MHR of 202 bpm, calculate the target heart rate range.
Solution:
Step 1: Calculate the lower limit (65% of MHR)
Step 2: Calculate the upper limit (85% of MHR)
Therefore, the target heart rate range is 131.3 to 171.7 bpm.
Exam Tip: Complete Range Required
When calculating THR, remember to calculate both the lower limit (65% of MHR) and upper limit (85% of MHR) to give the complete range. Exercising within this range ensures your heart and lungs receive maximum benefit while staying safe.
Blood pressure
Understanding blood pressure
Blood pressure measures the force of blood pushing against the walls of your arteries as your heart pumps blood around your body. During each heartbeat, blood pressure varies between two values:
- Systolic pressure (the higher number): Maximum pressure when the heart contracts and pushes blood out
- Diastolic pressure (the lower number): Minimum pressure when the heart relaxes between beats
Blood pressure is measured using a device called a sphygmomanometer, which consists of an inflatable cuff wrapped around your upper arm. The measurement is expressed in millimetres of mercury (mmHg).
Normal Blood Pressure
A normal healthy adult has a blood pressure of 120/80 mmHg
This is read as "120 over 80" where:
- 120 is the systolic pressure (higher reading)
- 80 is the diastolic pressure (lower reading)
Factors affecting blood pressure
Blood pressure changes throughout the day to meet your body's needs. Many factors can affect your blood pressure including:
- Physical activity and exercise
- Stress levels
- Disease and medical conditions
- Medications and drugs
- Time of day
Why Regular Monitoring Matters
Doctors may request regular blood pressure monitoring to track changes over time. This helps identify patterns and detect potential health issues early. Blood pressure naturally fluctuates, so multiple readings provide a more accurate picture of your cardiovascular health.
The following graph shows how blood pressure can vary for a patient over several months:
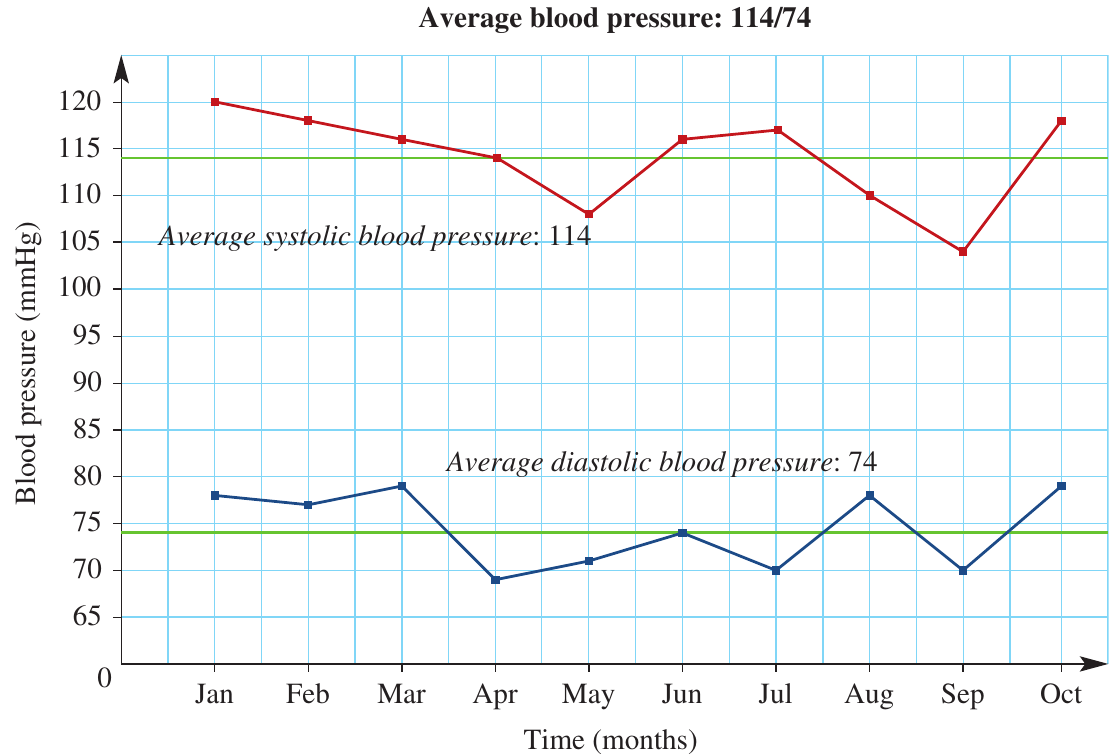
The graph shows:
- The red line represents systolic blood pressure (upper readings) averaging around 114 mmHg
- The blue line shows diastolic blood pressure (lower readings) averaging around 74 mmHg
- Both values fluctuate naturally over time but remain within a healthy range
Blood pressure classification
Blood pressure is classified into four categories:
| Category | Systolic (mmHg) | Diastolic (mmHg) |
|---|---|---|
| Normal | <120 | <80 |
| Normal to high | 120-139 | 80-89 |
| High | 140-179 | 90-109 |
| Very high | ≥180 | ≥110 |
Reading the table: Blood pressure is classified based on both systolic and diastolic readings. If either reading falls into a higher category, the overall classification uses the higher category.
Worked Example: Reading a Blood Pressure Table
Using the blood pressure classification table, answer the following questions:
Part a: What is the systolic blood pressure for very high blood pressure?
Solution:
Read the value in the table for "Very high" category, systolic column.
Systolic blood pressure is ≥180 mmHg.
Part b: What is the diastolic blood pressure for normal to high blood pressure?
Solution:
Read the value in the table for "Normal to high" category, diastolic column.
Diastolic blood pressure is 80-89 mmHg.
Part c: Stephanie has blood pressure of 117/74 mmHg. In what category is she classified?
Solution:
Step 1: Compare Stephanie's readings to the table
- Systolic: 117 is less than 120
- Diastolic: 74 is less than 80
Step 2: Both values fall in the "Normal" category
Therefore, Stephanie's blood pressure is classified as normal.
Blood types
Understanding blood types
A person's blood type is classified using two systems:
- ABO system: Uses letters A, B, AB or O
- Rh factor: Indicates whether blood is Rh positive (+) or Rh negative (−)
Combining these gives eight possible blood types: O+, O−, A+, A−, B+, B−, AB+, AB−
Blood type distribution in Australia
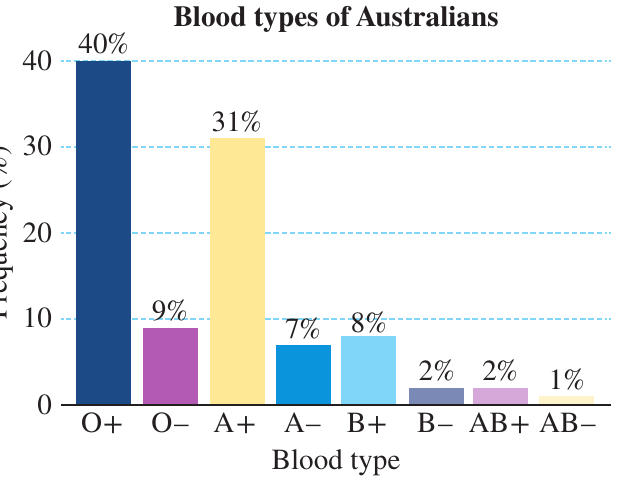
The column graph shows the percentage frequency of each blood type in Australia (Source: Australian Red Cross Blood Service):
- O+ is the most common (40% of the population)
- A+ is the second most common (31%)
- O− makes up 9% of the population
- B+ accounts for 8%
- A− represents 7%
- B−, AB+ and AB− are the rarest types (2%, 2% and 1% respectively)
Why Blood Donation Matters
Blood donation is vital for medical treatments. Most donated blood is used to treat people with cancer and other serious illnesses. Understanding blood type distribution helps blood services ensure adequate supplies of all blood types, especially the rarer ones like AB− which only represents 1% of the population.
Worked Example: Calculating Population by Blood Type
The table shows the population of New South Wales:
| NSW population | Number |
|---|---|
| Males | 3.72 million |
| Females | 3.83 million |
| Total | 7.55 million |
Question: How many males in NSW have blood type B+?
Solution:
Step 1: Read the percentage of blood type B+ from the column graph
Step 2: Read the male population of NSW from the table: 3.72 million
Step 3: Convert percentage to decimal and multiply by the population
Step 4: Calculate
Therefore, approximately 297,600 males in NSW have blood type B+.
Calculation tip: To convert a percentage to a decimal, divide by 100 (e.g., 8% = 0.08). Then multiply by the total population to find the number of people in that category.
Remember!
Key Formulas and Concepts:
Fuel Consumption:
- Formula: (Amount of fuel (L) × 100) ÷ Distance travelled (km)
- Lower values mean better efficiency
- Measured in L/100km
Maximum Heart Rate (MHR):
- Formula: 220 − Age
- This decreases as you get older
- Used to calculate safe exercise intensity
Target Heart Rate (THR):
- Range: 65% to 85% of your MHR
- Ensures safe and effective cardiovascular exercise
- Calculate both lower and upper limits
Resting Heart Rate:
- Normal range: 60-80 bpm
- Athletes have lower resting heart rates due to better fitness
- Can indicate overall cardiovascular health
Blood Pressure:
- Written as systolic/diastolic (e.g., 120/80 mmHg)
- Systolic (top number) is always higher than diastolic (bottom number)
- Normal blood pressure: less than 120/80 mmHg
- Regular monitoring helps track health changes
Blood Types:
- Most common in Australia: O+ (40%), followed by A+ (31%)
- Eight possible types: O+, O−, A+, A−, B+, B−, AB+, AB−
- Understanding blood type distribution is important for medical planning