Acceleration Along a Straight Line (HSC SSCE Physics): Revision Notes
Acceleration Along a Straight Line
What is acceleration?
When you watch sprinters in a 100 m race, they speed up very quickly at the start, then slow down after crossing the finish line. In everyday language, we might call the first part "acceleration" and the second part "deceleration." However, in physics, both are actually examples of acceleration – one is positive acceleration (speeding up) and the other is negative acceleration (slowing down).
In physics, we use the term acceleration for any change in velocity, whether speeding up or slowing down. This differs from everyday language where "acceleration" typically means only speeding up.
Acceleration measures how quickly velocity changes over a period of time. It occurs whenever there is a change in velocity, which includes:
- Changes in speed (getting faster or slower)
- Changes in direction (even if speed stays constant)
For motion in a straight line, which is our focus here, acceleration depends only on changes in speed, not direction.
Understanding positive and negative acceleration
The sign of acceleration depends on the direction of motion:
- Positive acceleration: When speed in the positive direction is increasing
- Negative acceleration: When speed in the positive direction is decreasing
A car going faster in reverse (negative direction) would have negative acceleration, because it's speeding up in the negative direction. The sign of acceleration depends on both the direction of motion and whether the object is speeding up or slowing down.
Calculating average acceleration
Acceleration occurs over a time interval. To find the average acceleration, we use this formula:
Where:
- = average acceleration (metres per second squared)
- = change in velocity (metres per second)
- = final velocity
- = initial velocity
- = time interval (seconds)
The units for acceleration are always (metres per second squared), which tells us how many metres per second the velocity changes each second.
Worked Example: Car Acceleration
Let's work through an example to see how this formula works in practice.
Problem: A car's speed increases from to in seconds. What was the car's average acceleration?
Solution:
Step 1: Extract the relevant data
- Initial velocity:
- Final velocity:
- Time interval:
Step 2: Use the acceleration formula
Step 3: Substitute the values
Step 4: Calculate the answer
The car's average acceleration was .
Instantaneous acceleration
Just as we can find instantaneous speed at a specific moment in time, we can also find instantaneous acceleration. This is the acceleration at one exact moment, rather than averaged over a time interval.
To find instantaneous acceleration:
- Make the time interval () extremely small, approaching zero
- Find the gradient of the velocity-time graph at that specific moment
For motion with constant acceleration, the average acceleration equals the instantaneous acceleration:
This is a special case that simplifies calculations significantly.
Acceleration-time graphs
Acceleration-time graphs are powerful tools for understanding motion. An important property of these graphs is that the area under an acceleration-time graph gives the change in speed.
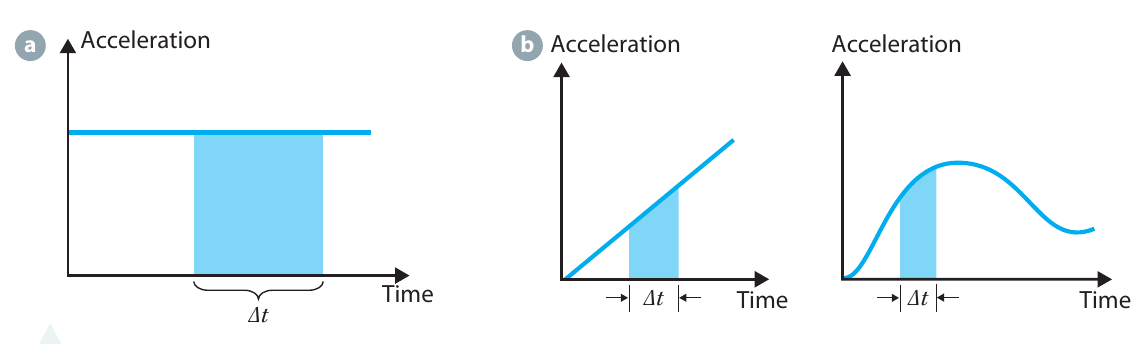
The diagram above shows three different scenarios:
Graph a: Constant acceleration
- The acceleration stays the same over time
- The shaded rectangular area represents the change in speed
- Area = acceleration × time interval
Graph b: Linearly increasing acceleration
- The acceleration increases steadily over time
- The shaded trapezoidal area represents the change in speed
Graph c: Variable acceleration
- The acceleration changes in a complex way over time
- Even with this irregular pattern, the shaded area still represents the change in speed
This relationship works for any acceleration pattern – constant, linear, or complex curves. The area under the acceleration-time graph always gives the change in speed, regardless of how complicated the motion is.
Working with velocity-time graphs
Velocity-time graphs are extremely useful for analyzing motion. You can extract two key pieces of information from these graphs:
- Acceleration = gradient (slope) of the line
- Displacement = area under the curve
Worked Example: Cruise Ship Motion
Let's work through a detailed example involving both types of graphs.
Problem: A cruise ship accelerates at a constant rate for minutes until it reaches a speed of . It then continues in a straight line for minutes at .
- Sketch a speed versus time graph (converting minutes to seconds, so time goes from to s)
- Find the ship's acceleration during the first minutes
- Sketch an acceleration versus time graph
Solution:
Part 1: Speed-time graph
The graph shows two sections:
- From to s: the speed increases linearly from to
- From to s: the speed remains constant at
Note: We convert minutes to seconds: s
Part 2: Calculate acceleration
Using the acceleration formula:
Part 3: Acceleration-time graph
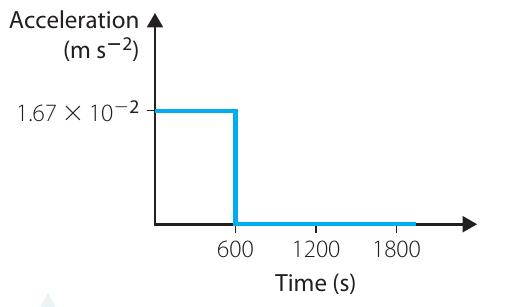
The acceleration-time graph shows:
- From to s: constant acceleration of
- From to s: zero acceleration (ship moving at constant speed)
Worked Example: Complex Velocity-Time Motion
Now let's analyze a more complex motion pattern.
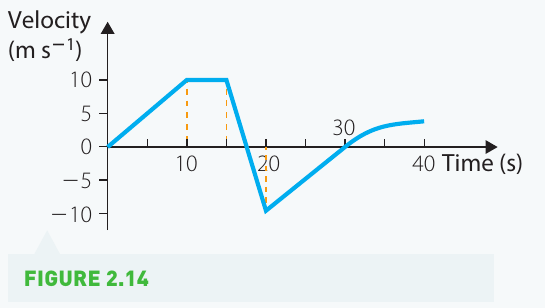
Problem: The velocity-time graph above shows an object moving along a straight line. Find:
- The displacement after s
- The acceleration at s
- The acceleration at s
Solution:
Part 1: Finding displacement
Displacement equals the area under the velocity-time graph. We need to break this into sections (triangles and rectangles):
The displacement after s is m.
Part 2: Finding acceleration at s
At s, the object is on the downward sloping section. The acceleration is the change in velocity divided by time:
The negative sign indicates the object is slowing down in the positive direction.
Part 3: Finding acceleration at s
To find the instantaneous acceleration at this point, we find the gradient of the tangent to the curve. Looking at the graph between s and s:
Exam Tips
-
Always include units in your calculations and final answers. Acceleration is measured in .
-
Watch your signs: Negative acceleration doesn't always mean slowing down – it depends on the direction of motion.
-
For velocity-time graphs:
- Gradient = acceleration
- Area = displacement
-
For acceleration-time graphs:
- Area = change in speed
-
When finding areas under curves: Break complex shapes into triangles, rectangles, and trapezoids for easier calculation.
-
Convert units carefully: Make sure all times are in seconds and speeds are in before calculating.
Key Points to Remember
-
Acceleration is the rate of change of velocity, calculated as
-
Acceleration can be positive (speeding up in the positive direction) or negative (slowing down in the positive direction)
-
Average acceleration is found over a time interval, while instantaneous acceleration is the gradient of a velocity-time graph at a specific moment
-
On a velocity-time graph: the gradient gives acceleration, and the area gives displacement
-
On an acceleration-time graph: the area gives the change in speed