Instrumental Analysis for Salts (VCE SSCE Chemistry): Revision Notes
Instrumental Analysis for Salts
Introduction to instrumental analysis
Modern chemistry relies on sophisticated instruments that provide faster and more accurate analysis than traditional laboratory techniques. When determining the concentration of salts in samples, instruments called colorimeters and UV-visible spectrophotometers offer several advantages:
Advantages of instrumental analysis:
- They can measure very low concentrations that would be difficult to detect with traditional methods
- Results are obtained more quickly
- Measurements are more precise and accurate
These instruments work by measuring how light interacts with solutions. The intensity of a solution's color provides information about its concentration, which these instruments can measure with great accuracy.
Spectroscopy
Spectroscopy is the study of how electromagnetic radiation interacts with matter. Understanding this interaction helps us analyze the composition of materials.
Electromagnetic radiation and the electromagnetic spectrum
Light is a form of energy called electromagnetic radiation. Other forms include radio waves, microwaves, infrared radiation, ultraviolet light, and X-rays. The electromagnetic spectrum shows the spread of different types of radiation arranged according to their relative energies and wavelengths.
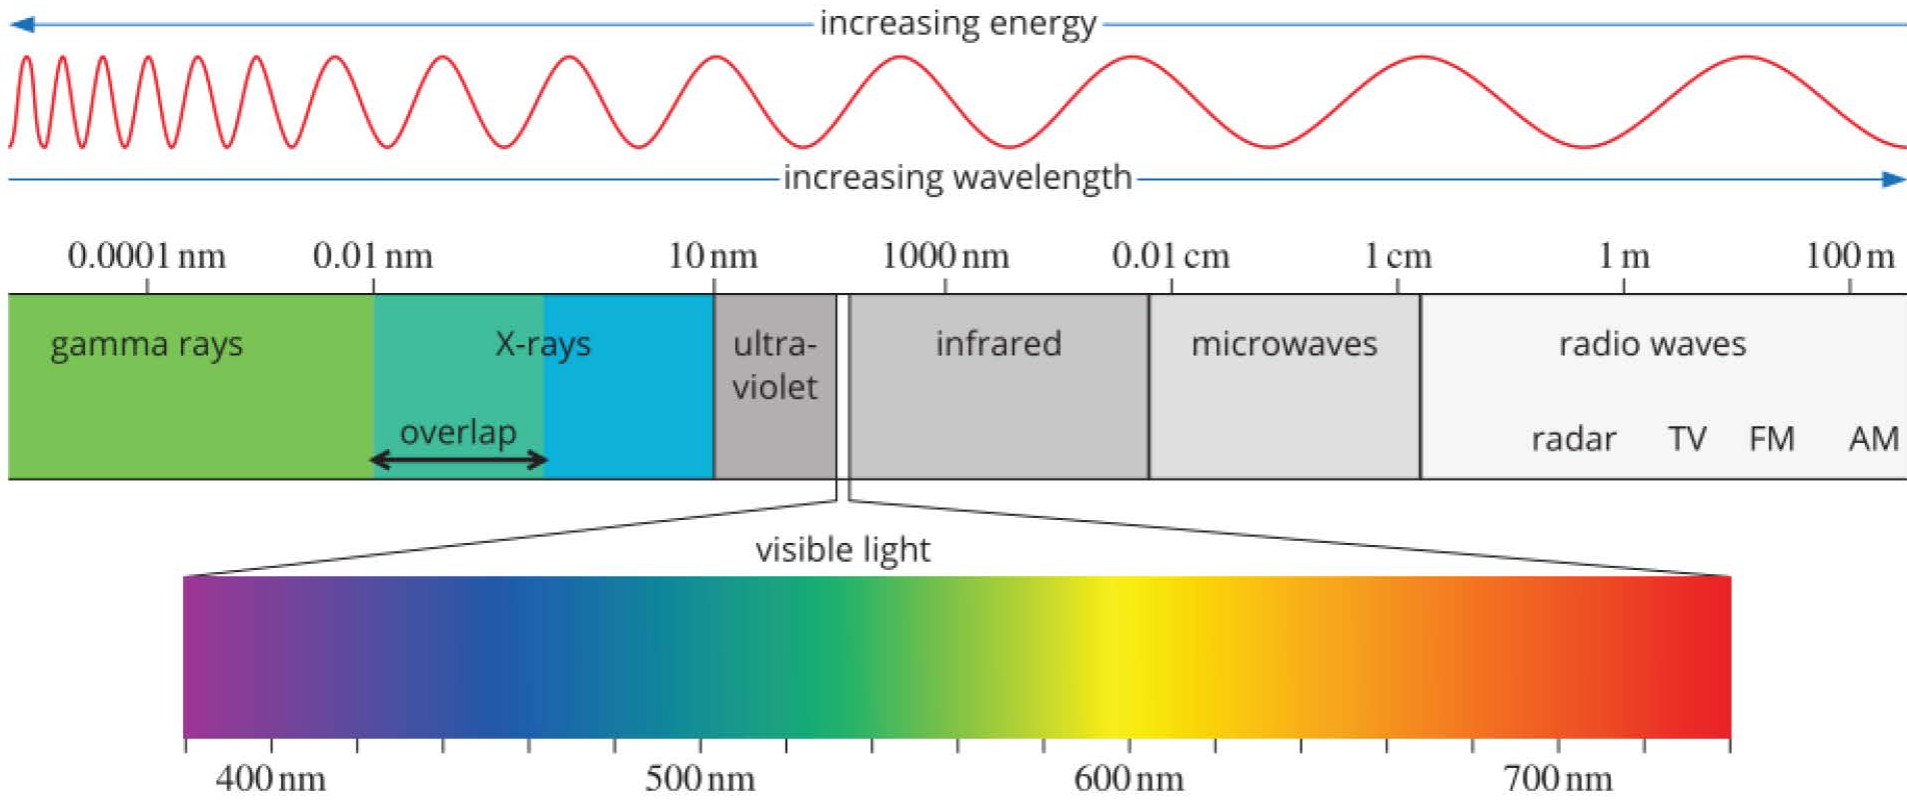
Visible light occupies only a small portion of the electromagnetic spectrum, corresponding to wavelengths between nm and nm. This is the region used in colorimetry and UV-visible spectroscopy for salt analysis.
How color and light absorption work
When light passes through a colored solution, some wavelengths are absorbed while others are transmitted (pass through) or reflected. The color you observe is not the color being absorbed—it's actually the complementary color.
Understanding color perception:
For example, a solution of potassium permanganate () appears purple because it absorbs yellow-green light (around nm). The light that passes through—violet, blue, and red—combines to give the purple color we see.
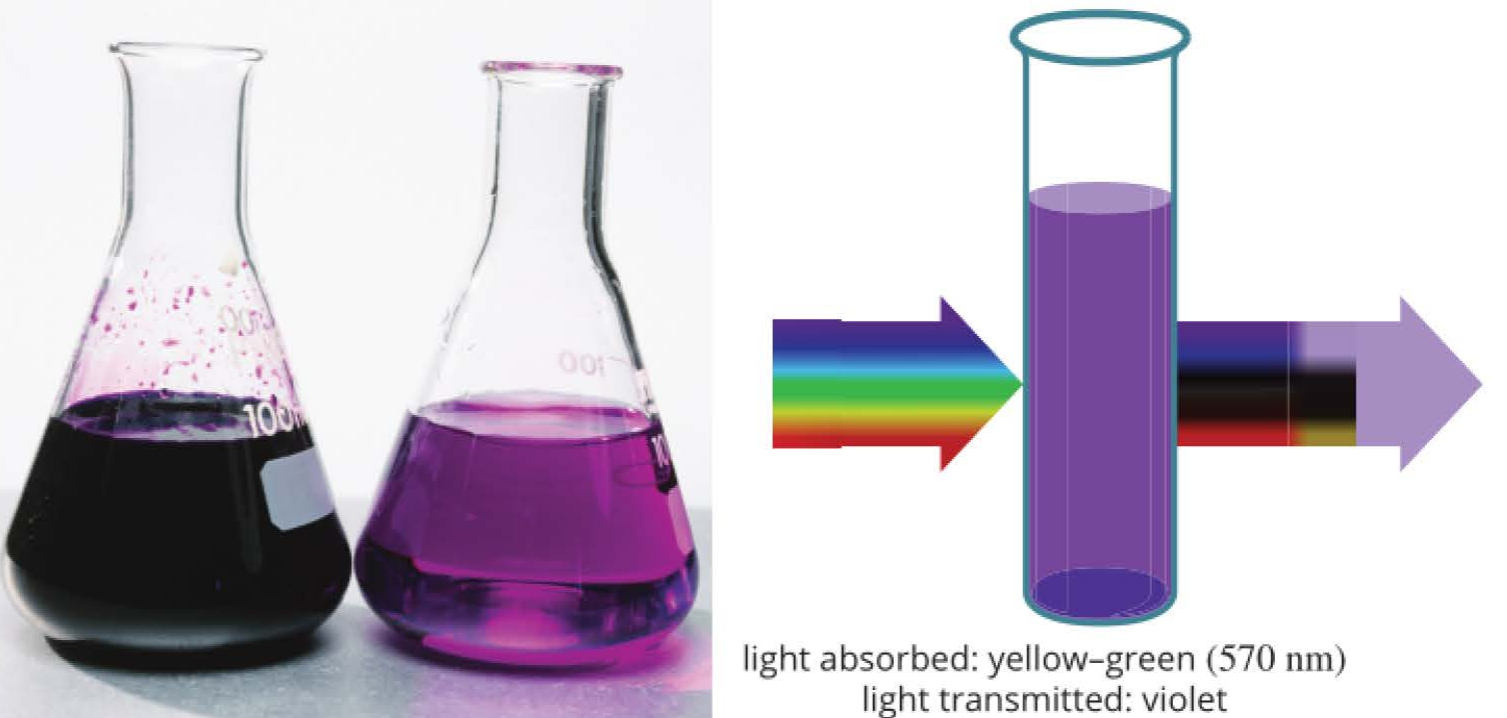
The more concentrated a solution, the more light it absorbs. A M solution of potassium permanganate appears darker than a M solution because it absorbs more light.
Complementary colors
The relationship between absorbed and observed colors is described by complementary colors. These color pairs are opposite to each other on the color wheel.
| Wavelength (nm) | Color absorbed (color of filter) | Color observed |
|---|---|---|
| Violet | Yellow | |
| Violet-blue | Yellow-orange | |
| Blue | Orange | |
| Blue-green | Orange-red | |
| Green | Red | |
| Yellow-green | Purple (red + violet) | |
| Yellow | Violet | |
| Orange | Blue | |
| Orange-red | Blue-green | |
| Red | Green |
Memory aid for complementary colors:
Write ROYGBV (Red, Orange, Yellow, Green, Blue, Violet) in order of decreasing wavelengths. Write the complementary colors directly below, starting from Green: GBVROY. This gives you the complementary pairs.
Colorimetry
Colorimetry is a technique that measures the intensity of color in a solution to determine its concentration. Samples may need to be treated with chemical compounds to produce a colored product suitable for analysis.
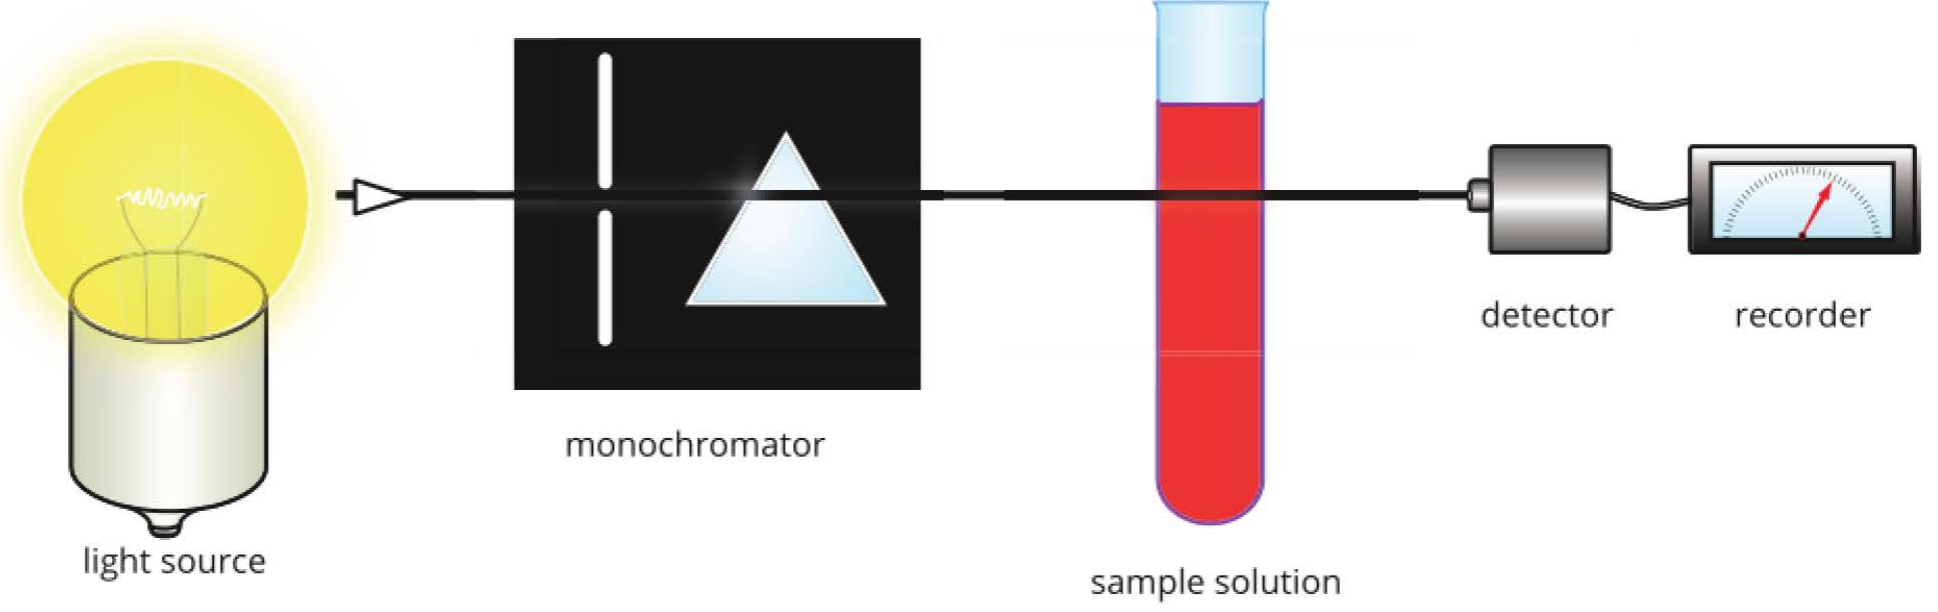
Components of a colorimeter
A colorimeter consists of three main components:
- Light source: Produces light that passes through a filter to select a particular color (wavelength) for the analysis
- Sample cell: A glass, plastic, or quartz container that holds the solution being analyzed
- Detector and recorder: Electronic device that measures the absorbance of light and displays the result
The filter selects light of the color that the sample absorbs most strongly. For example, if analyzing a solution that appears purple (like ), you would use a yellow-green filter because that's the complementary color—the color being absorbed.
The absorbance reading ranges from 0.00 (no absorption) to 1.00 (complete absorption).
Calibration curves
To determine an unknown concentration using colorimetry, you must first create a calibration curve. This involves:
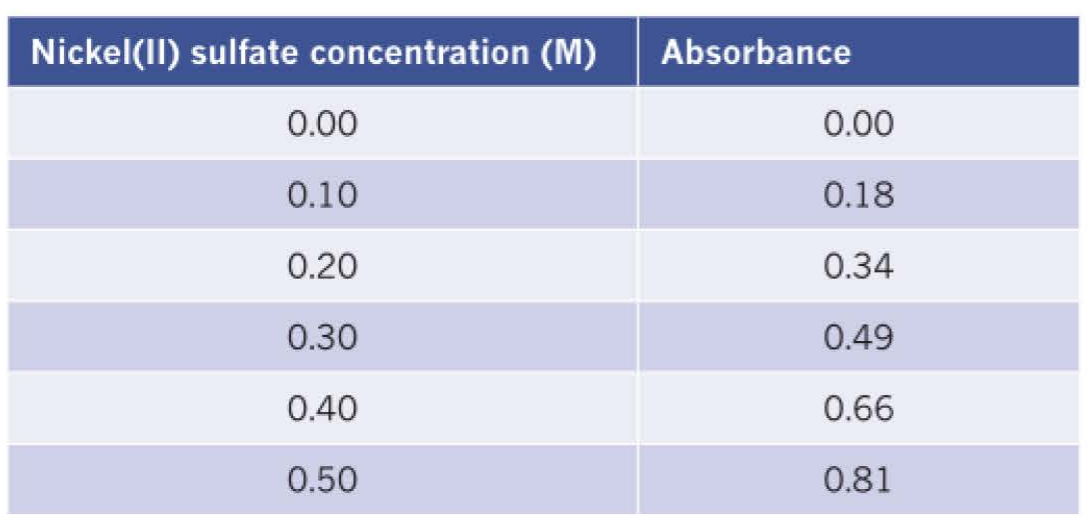
Step 1: Prepare standard solutions
Create a series of standard solutions—solutions with accurately known concentrations. For example, if analyzing nickel(II) sulfate, you might prepare solutions ranging from M to M.
Step 2: Measure absorbances
Measure the absorbance of each standard solution at the selected wavelength.
Example data for nickel(II) sulfate analysis:
Step 3: Plot the calibration curve
Create a graph with:
- Concentration on the -axis (independent variable)
- Absorbance on the -axis (dependent variable)
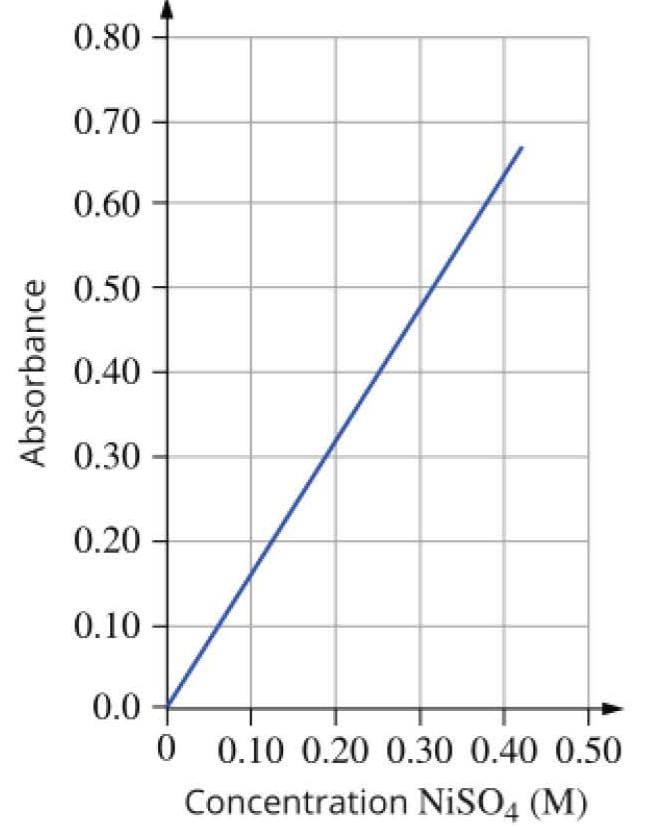
The calibration curve should show a linear relationship between concentration and absorbance.
Step 4: Determine unknown concentration
Measure the absorbance of your unknown sample and use the calibration curve to find the corresponding concentration.
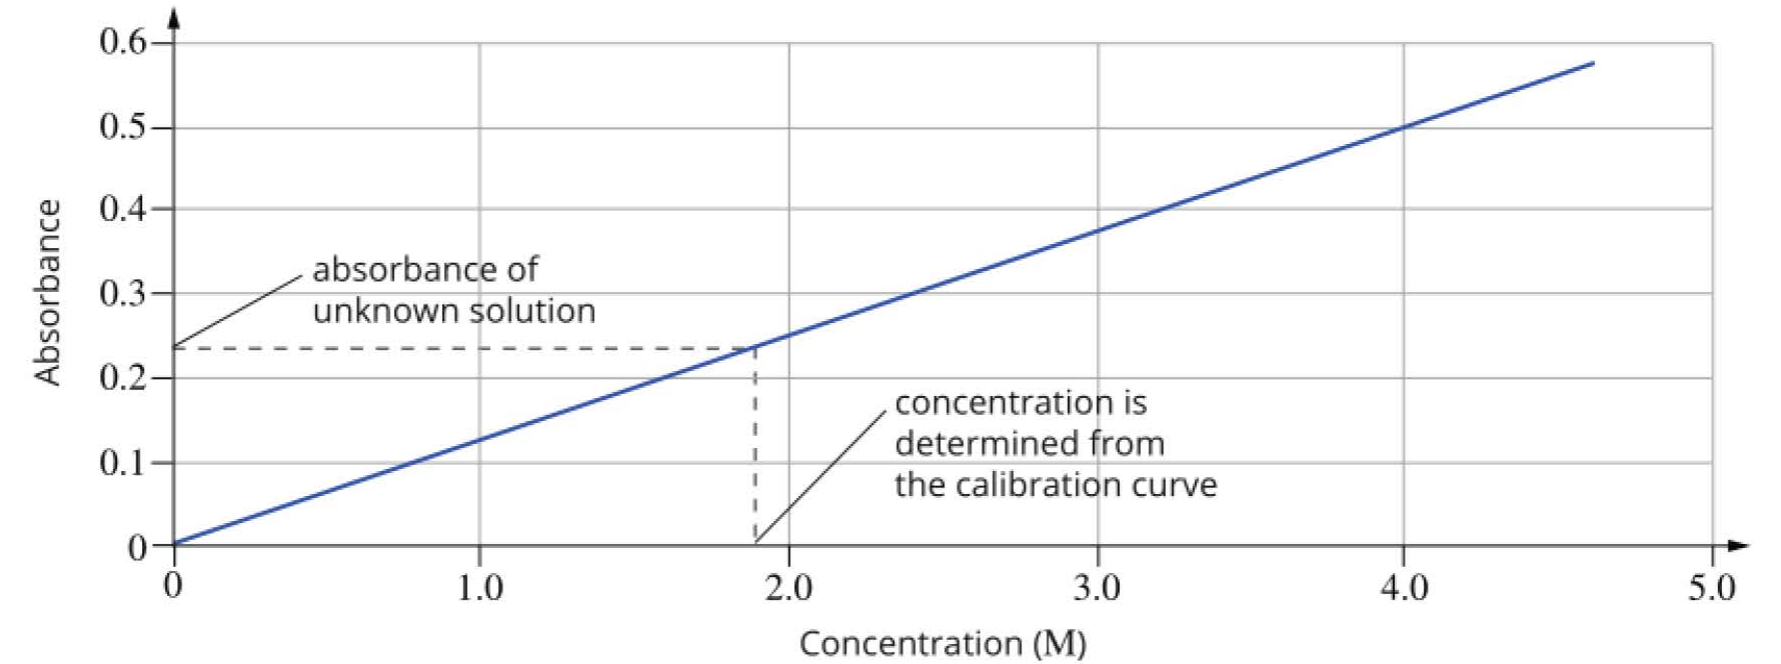
Critical consideration:
If the unknown sample's absorbance is higher than your highest standard, you must dilute the sample and re-measure. This ensures accurate readings within the calibrated range.
Worked example: Using a calibration curve
Worked Example: Determining Iron Concentration in Dam Water
Problem: The concentration of iron in dam water is determined by colorimetry. The absorbances of standard solutions and a water sample are shown below. Determine the concentration of iron (as ) in the sample.
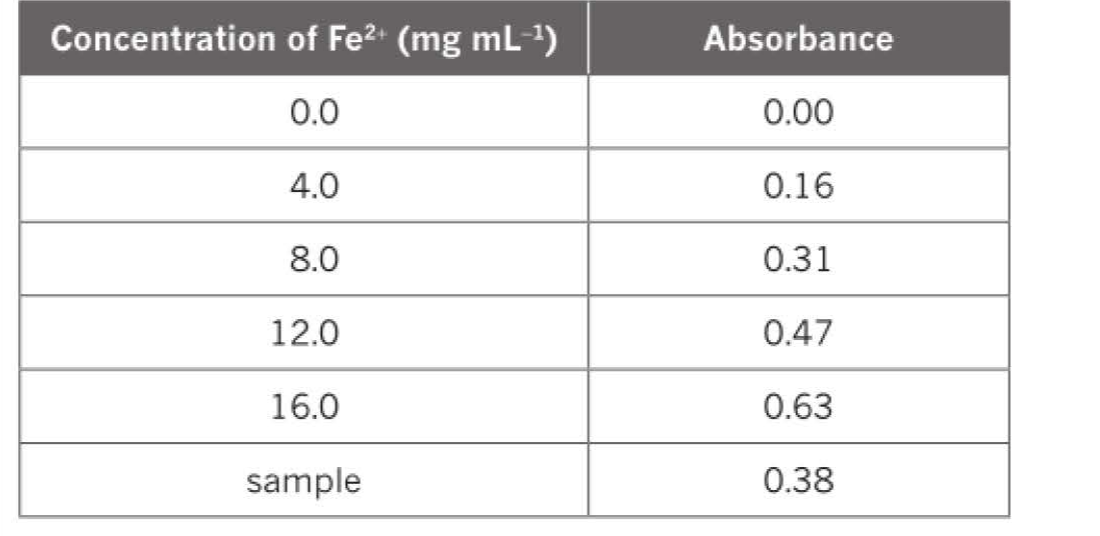
Solution:
The calibration curve shows the relationship between iron concentration and absorbance:
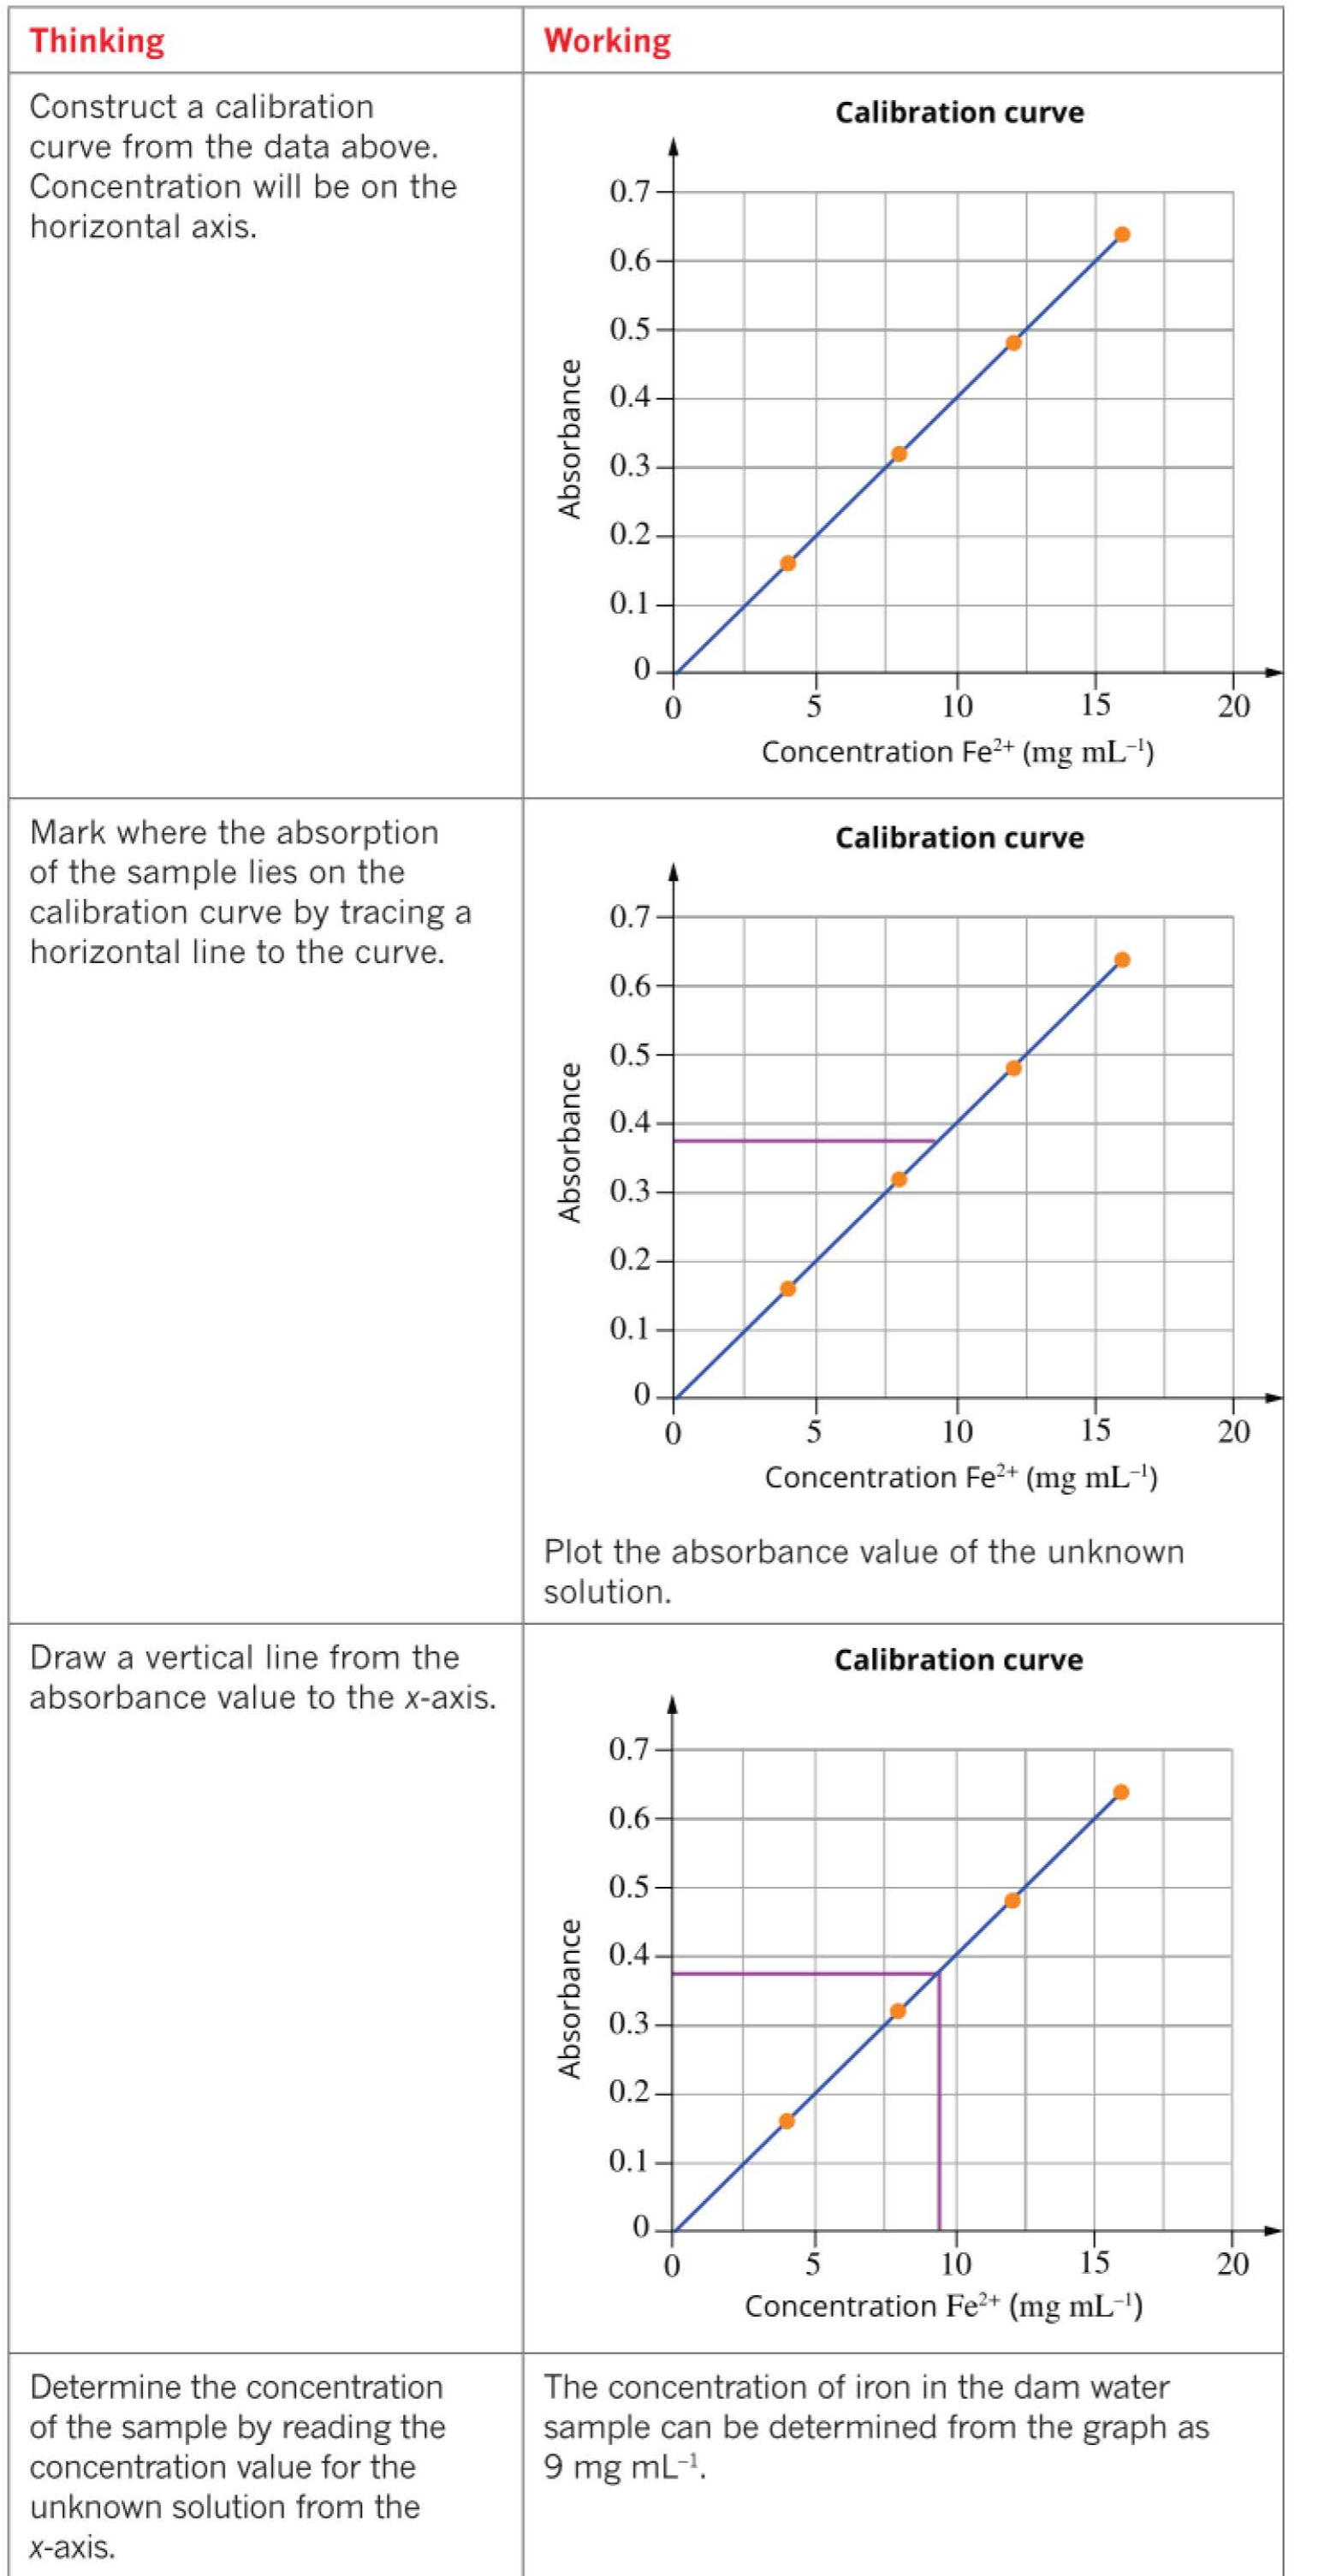
Following the procedure:
- Plot all standard solution data points
- Draw a best-fit line through the points
- Find the sample absorbance () on the -axis
- Draw a horizontal line to the calibration curve
- Draw a vertical line down to the -axis
- Read the concentration value
Answer: The concentration of iron in the dam water sample is 9 mg mL⁻¹.
UV-visible spectroscopy
A UV-visible spectrophotometer is a more sophisticated instrument than a colorimeter. The key difference is that it uses a monochromator instead of a filter.
Monochromator function
A monochromator splits white light into individual wavelengths, which can be precisely selected using computer control. This provides several advantages:
- Exact wavelength selection (not just broad color ranges)
- Can measure in both ultraviolet and visible regions
- More accurate measurements
Scanning for optimal wavelength
Before analyzing samples, you can scan the solution across multiple wavelengths to determine which wavelength gives the strongest absorbance.
Scanning advantages:
For example, scanning a chlorophyll solution shows strong absorbance at approximately nm (violet light) and nm (red light). You would then conduct your analysis at one of these wavelengths for maximum sensitivity.
The wavelength chosen for analysis should be one where:
- The target compound absorbs strongly
- Other compounds in the solution do not absorb
Metal complexes
Some metal ions, such as , do not absorb visible light strongly enough for direct analysis. These ions must first be converted into colored metal complexes.
What is a metal complex?
A metal complex is formed when metal ions bond to molecules or anions called ligands. Transition metals readily form brightly colored complexes suitable for spectroscopic analysis.
Example: Iron(II) phenanthroline complex
When ions react with -phenanthroline (abbreviated as phen), a bright orange complex forms:
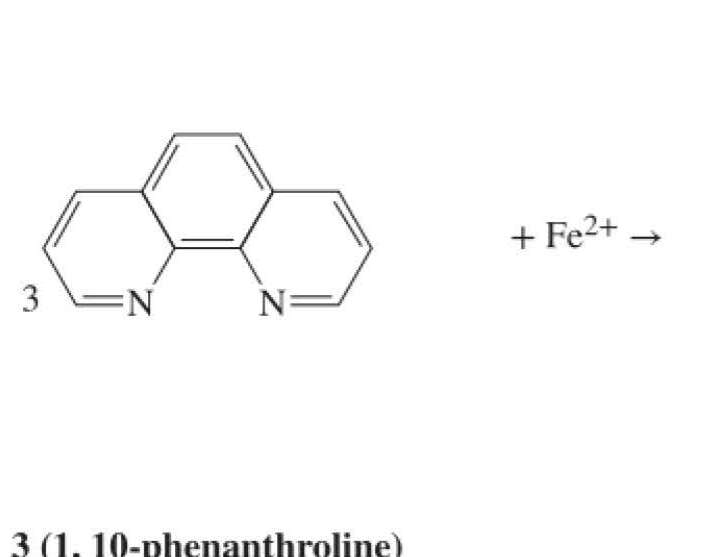
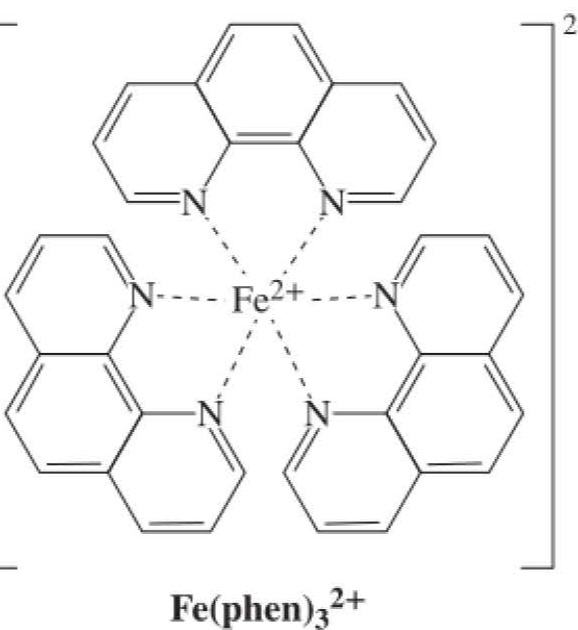
The reaction is:
This orange complex, , can then be analyzed using colorimetry or UV-visible spectroscopy.
Summary of analysis procedure
Complete Analysis Procedure:
- Form a colored complex (if the metal ion is not strongly colored)
- Select the wavelength or filter that corresponds to the light absorbed most strongly
- Measure absorbances of standard solutions at the selected wavelength
- Plot a calibration curve (absorbance vs. concentration)
- Measure the sample absorbance and determine concentration from the calibration curve
- Account for any dilutions made during sample preparation
Extracting salts from soil
Soil contains a complex mixture called the soil matrix:
- Inorganic particles (minerals: sands, silts, clays)
- Organic matter (decaying plant or animal material)
- Living organisms (fungi, bacteria, protozoans, invertebrates)
Salts can be located anywhere within this matrix—inside cells, bonded to organic matter, within minerals, or dissolved in water.
Extraction procedure
To analyze salts in soil, they must first be extracted into a liquid:
- Accurately weigh a dried soil sample
- Add an extraction liquid (often water-based) to dissolve the target salt
- Remove solid material from the extract (by filtration)
- Dilute the extract to an accurate volume using a volumetric flask
- Analyze the extract using colorimetry or UV-visible spectroscopy
- Determine concentration using a calibration curve
- Calculate the mass or moles of salt per gram of soil
Calculating salt concentration in soil
Essential formula for soil concentration calculations:
Ensure the volume units match (e.g., both in litres).
Worked example: Amount of salt in soil
Worked Example: Determining Tin Concentration in Soil
Problem: A soil sample suspected of tin contamination was dried and weighed ( g). After acid extraction and dilution to mL, the tin concentration was measured as . Calculate the concentration of tin in the soil.
Solution:
| Thinking | Working |
|---|---|
| Check volume units | Volume: mL Concentration: (litres) |
| Convert mL to L | |
| Apply formula | |
| Calculate |
Answer: The concentration of tin in the soil is 0.46 mg g⁻¹.
Applications of colorimetry and UV-visible spectroscopy
These techniques are used extensively across many fields:
Major application areas:
Environmental monitoring:
- Measuring nitrate and phosphate levels in water
- Determining heavy metal concentrations in soil
Medical testing:
- Blood sugar levels
- Cholesterol measurements
- Hemoglobin concentration in blood
Workplace safety:
- Monitoring airborne chromium exposure
- Detecting lead in various samples
Specific examples:
Chromium workplace monitoring: Workers carry a pump with a filter that collects air particles. Chromium is extracted from the filter and converted to yellow chromate ions () for analysis.
Soil phosphate analysis: Phosphate ions are extracted from soil, then reagents (ammonium molybdate and tin(II) chloride) are added to form a dark-blue complex called phospho-molybdenum blue, which is then analyzed.
Portable colorimeters now allow on-site testing in the field, while laboratory UV-visible spectrophotometers provide more precise measurements for complex analyses.
Case study: Flow injection analysers
Flow Injection Analysis (FIA) is an automated technique designed to handle large numbers of samples efficiently. It solves practical problems encountered when:
- Analyzing hundreds of samples
- Testing for multiple compounds
- Working with very small sample volumes
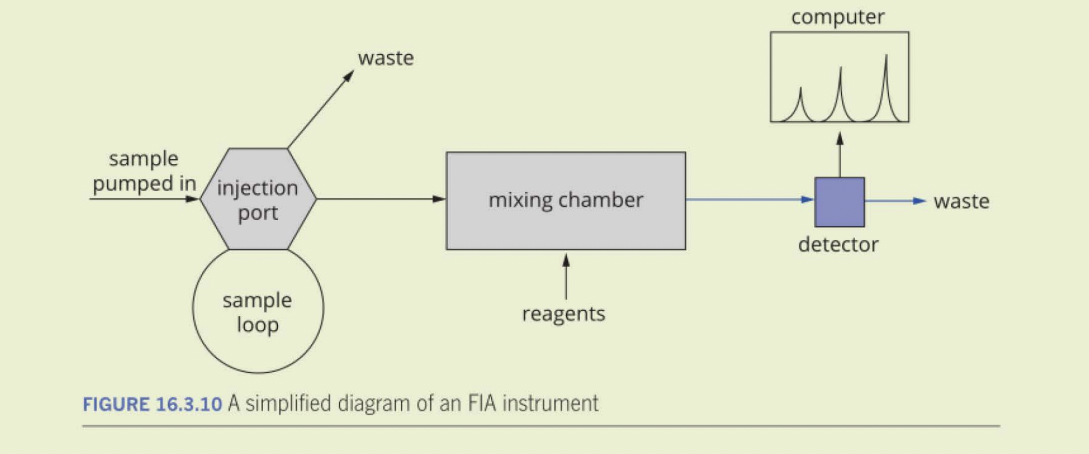
How FIA works
Components:
- Injection port for standards and samples
- Sample loop (thin tube collecting a set volume)
- Mixing chamber where reagents are added
- Detector measuring absorbance at specific wavelengths
- Computer software for recording and calculating results
- Waste collection system
Procedure:
- Standards and samples are pumped into the injection port
- A precise volume is collected in the sample loop
- The sample is injected into mixing chambers
- Reagents are automatically added to create a colored solution
- The colored solution flows through the detector
- Absorbance values are recorded and processed by computer
- Calibration curves are created and sample concentrations calculated automatically
- Waste is collected for proper disposal
Field applications
Portable FIA instruments allow researchers to obtain real-time data in the field. These systems are powered by car batteries and enable immediate analysis of water quality parameters.
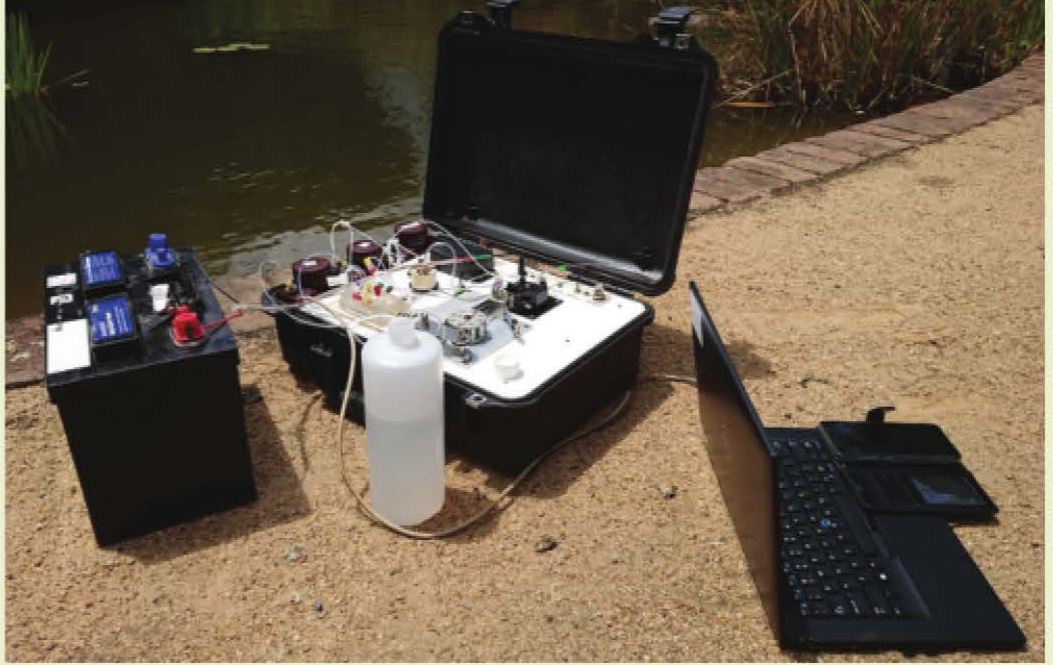
FIA can analyze many substances including: nitrate, nitrite, phosphate, ammonia, sulfate, sulfide, fluoride, bromide, chloride, cyanide, aluminum, and silica.
Example data from Dandenong Creek monitoring:
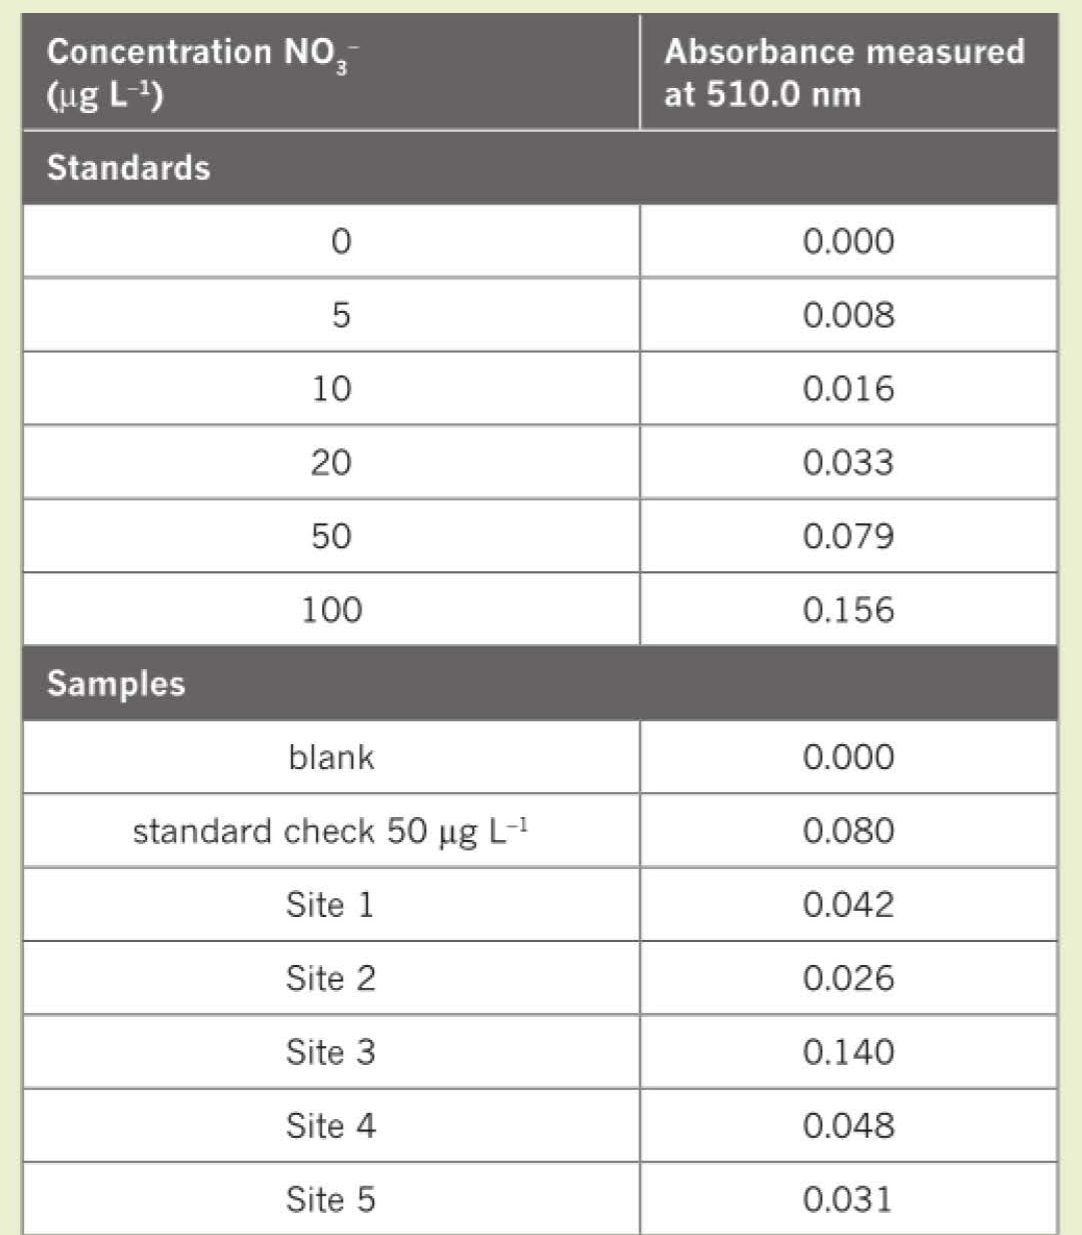
Quality control features:
- Blank samples check for contamination
- Standard checks verify instrument performance remains consistent during analysis
Exam tip: When interpreting calibration data, always check that blank absorbance is zero and that standard checks fall within acceptable ranges of their expected values.
Summary
Key Points to Remember:
- Colorimeters and UV-visible spectrophotometers measure light absorption to determine solution concentrations
- The color you observe is complementary to the color absorbed
- Use ROYGBV/GBVROY to remember complementary color pairs
- Calibration curves plot absorbance (-axis) versus concentration (-axis) for standard solutions
- UV-visible spectrophotometers use monochromators for precise wavelength selection, making them more accurate than colorimeters
- Some metal ions must form colored complexes with ligands before analysis
- When calculating salt concentration in soil:
- These techniques have wide applications in environmental monitoring, medical testing, and workplace safety