Drawing Straight-Line Graphs and Finding Their Slope (VCE SSCE General Mathematics): Revision Notes
Drawing Straight-Line Graphs and Finding Their Slope
Introduction to linear relations
Linear relations are mathematical relationships that produce straight-line graphs when plotted. These relations are defined by equations such as:
Examples of linear equations:
All these equations create straight lines when we plot them on a coordinate plane. Understanding how to draw these graphs and find their slope is essential for analysing linear relationships.
Plotting straight-line graphs
To draw a straight-line graph from a linear equation, follow this systematic approach:
Step 1: Create a table of values
Choose several values for and calculate the corresponding values using your equation.
Worked Example: Creating a table for
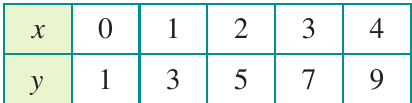
Working through the calculations:
- When :
- When :
- When :
- And so on...
Step 2: Plot the points
Mark each coordinate pair from your table on a set of axes. For instance, the first point would be , the second , and so on.
Step 3: Draw the line
Once you've plotted all the points, you'll notice they form a straight line. Use a ruler to draw a line through these points, and label it with the equation.
Always use a ruler when drawing straight-line graphs. Hand-drawn lines may look curved and could cost you marks in exams.
Worked example: constructing a graph from a table
Worked Example: Plotting
Let's work through plotting the graph of using values of .
Creating the table:
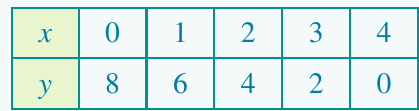
Calculate each value:
- When :
- When :
- When :
- When :
- When :
Drawing the graph:
First, draw and label your axes, ensuring they cover all the values from your table.
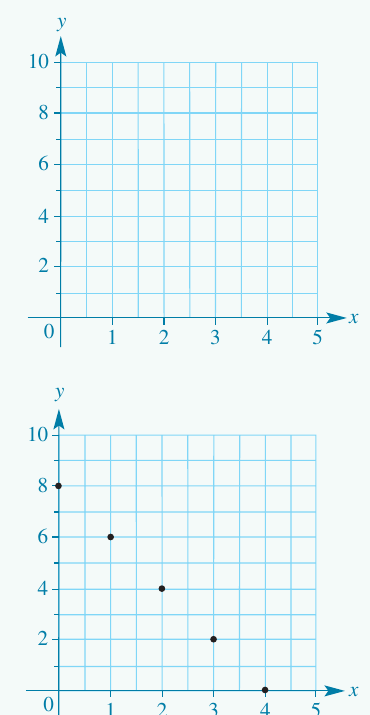
Next, plot each point from the table. Mark the first point at , the second at , and continue with the remaining points.
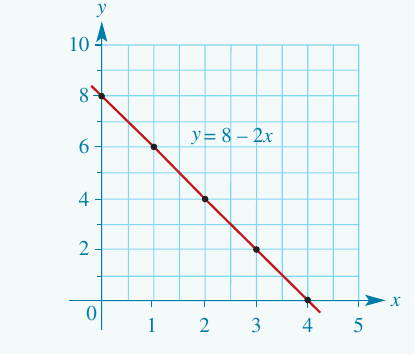
Finally, use a ruler to draw a straight line through all the points and label the line with its equation.
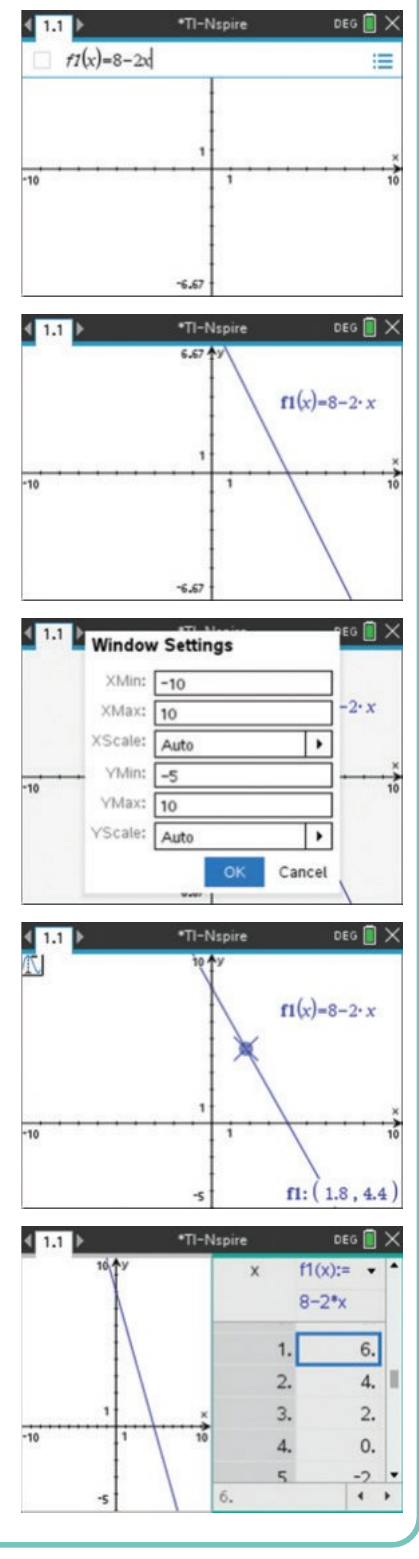
Using technology
Graphing calculators can be helpful tools for plotting linear graphs and creating tables of values quickly. While manual plotting is essential to understand the concept, technology can verify your work and handle more complex examples efficiently.
Understanding slope
The slope of a straight line (also called the gradient) describes its steepness and direction. The slope tells us how much the line rises or falls as we move from left to right.
Positive slopes
Lines with positive slopes rise as you move from left to right. These lines go upward.
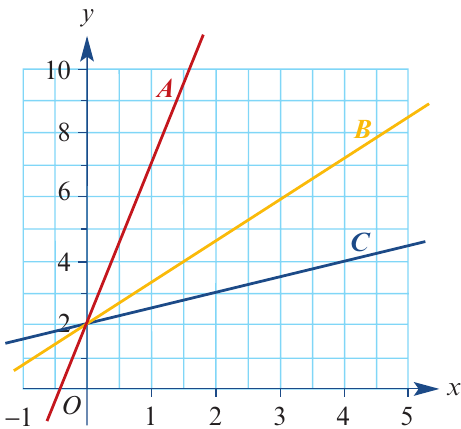
In the graph above, all three lines (A, B, and C) have positive slopes, but they differ in steepness:
- Line A has the steepest slope
- Line B has a moderate slope
- Line C has the gentlest slope
All three lines rise from left to right, which indicates positive slopes.
Negative slopes
Lines with negative slopes fall as you move from left to right. These lines go downward.
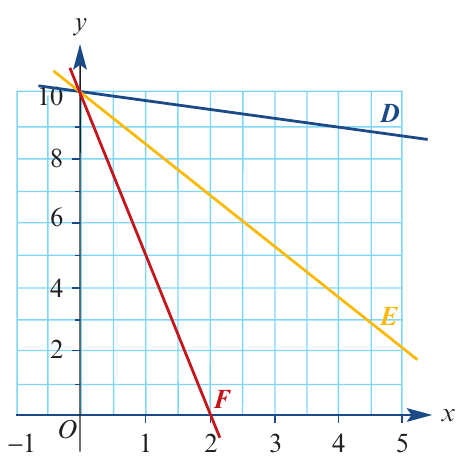
In this graph, all three lines (D, E, and F) have negative slopes:
- Line F has the steepest negative slope
- Line E has a moderate negative slope
- Line D has the gentlest negative slope
All three lines fall from left to right, which indicates negative slopes.
Parallel lines
Lines that are parallel have the same slope, even if they cross the -axis at different points.
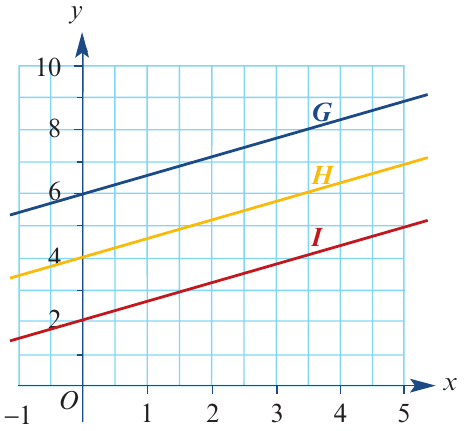
The three lines G, H, and I all have identical slopes but different -intercepts. This is why they never meet – they're parallel.
Calculating the slope
To find a numerical value for the slope of a line, we use the rise over run formula.
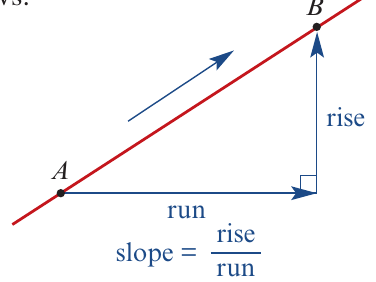
When moving from point A to point B along a line:
- The rise is the vertical distance (change in )
- The run is the horizontal distance (change in )
Formula for slope:
Finding slope from coordinates
To find the rise, examine the -coordinates of your two points.
To find the run, examine the -coordinates of your two points.
Worked Example: Finding a positive slope
Find the slope of the line passing through the points and .
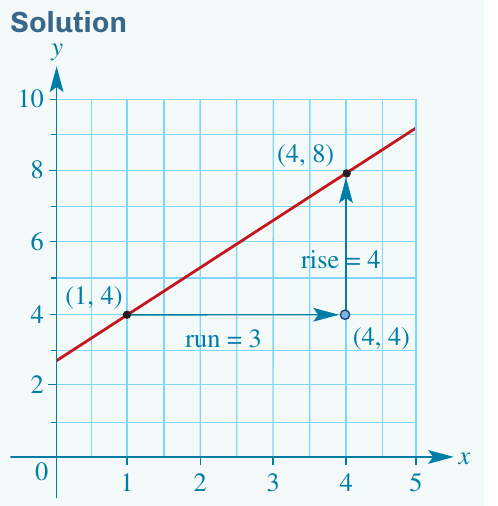
Solution:
Calculate the rise (change in ):
Calculate the run (change in ):
Therefore:
The positive value confirms that this line rises from left to right.
Worked Example: Finding a negative slope
Find the slope of the line passing through the points and .
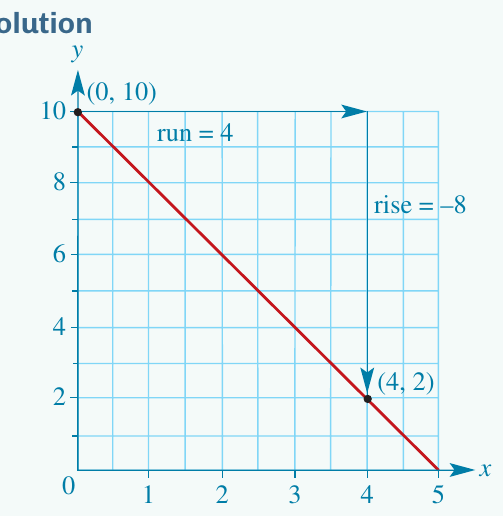
Solution:
Calculate the rise (change in ):
Calculate the run (change in ):
Therefore:
The negative rise represents a fall. The negative slope value confirms that this line falls from left to right.
Special cases
Horizontal lines (zero slope)
A horizontal line is parallel to the -axis and has a slope of zero.
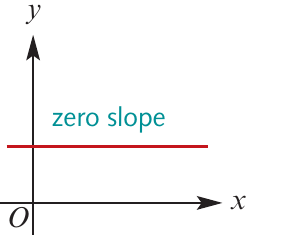
For horizontal lines, there is no rise (the -value stays constant), so:
Vertical lines (undefined slope)
A vertical line is parallel to the -axis and has an undefined slope.
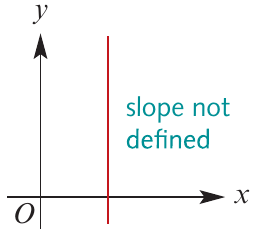
For vertical lines, there is no run (the -value stays constant), so we would be dividing by zero:
Division by zero is impossible, so we say the slope is undefined.
Don't confuse zero slope with undefined slope! Horizontal lines have slope = 0; vertical lines have undefined slope.
Key Points to Remember:
-
Linear equations create straight-line graphs when plotted on coordinate axes.
-
To plot a straight-line graph: create a table of values, plot the points, and draw a straight line through them using a ruler.
-
Slope (or gradient) measures the steepness and direction of a line, calculated using the formula .
-
Positive slopes rise from left to right (upward); negative slopes fall from left to right (downward).
-
Special cases: horizontal lines have zero slope; vertical lines have undefined slope.