Piecewise Linear Graphs (VCE SSCE General Mathematics): Revision Notes
Piecewise Linear Graphs
What are piecewise linear graphs?
In many real-world situations, a single linear equation isn't enough to describe what's happening. Sometimes we need to use two or more different linear equations, each applying to a different range of values. When we use multiple linear equations together like this, we create what's called a piecewise linear graph.
Think of it as using different rules for different sections. For example, a delivery company might charge one rate for small orders and a different rate for larger orders. Each rate would be represented by its own linear equation, valid only for certain order sizes.
Piecewise linear graphs are particularly useful in real-world situations where pricing structures, rates, or rules change at specific threshold values. You'll encounter them in contexts like:
- Delivery charges that change based on quantity
- Tax brackets where different rates apply to different income ranges
- Utility bills with tiered pricing structures
Understanding piecewise equations
Piecewise equations come with important information about when to use each equation. This is shown using interval notation with inequality symbols.
Here's what the symbols mean:
- means "less than or equal to" (the value is included)
- means "less than" (the value is not included)
- means "greater than or equal to" (the value is included)
- means "greater than" (the value is not included)
For example, if you see , this means:
- can be any value from up to (but not including)
- So could be , , , or , but not
If you see , this means:
- can be any value from to , including both and
- So could be , , , or any value in between
The key skill is matching your -value to the correct interval, so you know which equation to use. A common mistake is using the wrong equation because you didn't check the interval boundaries carefully. Always verify whether the boundary value uses or to determine if it's included.
Constructing piecewise linear graphs
Let's work through a complete example to see how piecewise linear graphs are constructed and used.
Worked Example: Crushed Rock Delivery Costs
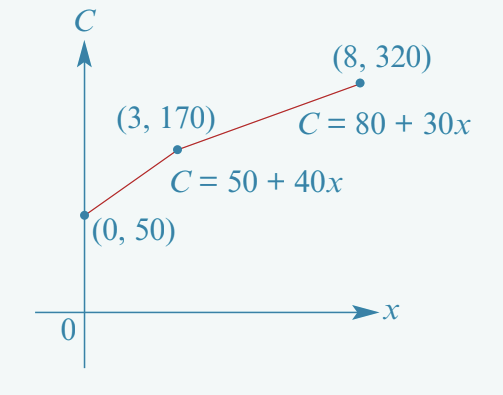
A supplier charges different rates depending on how much crushed rock is ordered. The cost (in dollars) for cubic metres of crushed rock is given by these equations:
Part 1: Finding costs for specific amounts
To find the cost for a particular amount, we need to:
- Identify which interval our -value falls into
- Use the corresponding equation
- Substitute the -value and calculate
For 2.5 m³:
Since is between and (but less than ), we use the first equation:
The cost for m³ of crushed rock is $150.
For 3 m³:
Since , we need to check which interval includes . Looking at the intervals:
- First equation: - does not include
- Second equation: - does include
So we use the second equation:
The cost for m³ of crushed rock is $170.
For 6 m³:
Since is between and , we use the second equation:
The cost for m³ of crushed rock is $260.
Part 2: Drawing the piecewise linear graph
To construct the graph, follow these steps:
Step 1: Find the coordinates of the endpoints for each line segment.
For the first equation where :
- When : , giving point
- When : , giving point
For the second equation where :
- When : , giving point
- When : , giving point
Step 2: Draw labelled axes with appropriate scales.
Step 3: Plot the endpoints and join them with straight lines.
Step 4: Label each line segment with its equation.
Notice that both segments meet at the point , which is where the pricing structure changes. The graph will show two connected line segments with different slopes (gradients).
Step graphs
A step graph is a special type of piecewise graph where all the line segments are horizontal. Instead of sloping lines, the graph looks like a series of steps or stairs.
Step graphs are particularly useful for modelling situations where values remain constant for a period and then change suddenly at specific points. Common examples include:
- Interest calculated and added at the end of each year
- Parking fees that change at each hour
- Postage costs that depend on weight brackets
Key features of step graphs
On a step graph, you'll often see two types of dots that clarify exactly when values change:
Understanding Step Graph Notation:
- Filled circles (●) show that the endpoint is included in that segment
- Hollow circles (○) show that the endpoint is not included
This notation helps clarify exactly when the change from one level to the next occurs.
Worked example: compound interest
Worked Example: Compound Interest
Sophie invests $10,000 at 12% per annum compound interest. The interest is calculated at the end of each year and then added to her investment.
Here's how the investment grows over 5 years:
| Time period (years) | Amount of interest earned (to nearest dollar) | Total amount |
|---|---|---|
| 0–1 | $0 | $10,000 |
| 1–2 | $1,200 | $11,200 |
| 2–3 | $1,344 | $12,544 |
| 3–4 | $1,505 | $14,049 |
| 4–5 | $1,686 | $15,735 |
To sketch this as a step graph:
Step 1: Identify that the total amount stays constant during each year, then jumps at the end of the year.
Step 2: For each time interval, draw a horizontal line segment at the corresponding total amount.
Step 3: Use filled circles to show where each segment begins (the amount is in the account) and hollow circles where it ends (just before the next jump).
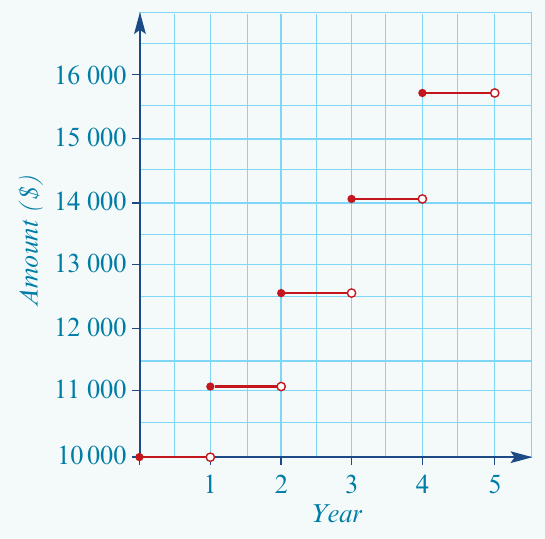
The graph shows the characteristic "staircase" pattern of a step graph. During each year, the amount remains constant (shown by the horizontal segments). At the end of each year, when interest is calculated and added, the amount jumps to the next level.
Remember!
-
Piecewise linear graphs use two or more different linear equations, each applying to a specific interval of -values.
-
Always check the interval notation carefully to determine which equation to use. Pay attention to whether the boundary values are included ( or ) or excluded ( or ).
-
When constructing a piecewise linear graph, find the endpoints for each segment, plot them, join them with straight lines, and label each segment with its equation.
-
Step graphs are a special type of piecewise graph where all line segments are horizontal, creating a staircase pattern.
-
Step graphs are ideal for modelling situations where values change at discrete points rather than continuously, such as compound interest calculated yearly.