Inverse Variation (VCE SSCE General Mathematics): Revision Notes
Inverse Variation
What is inverse variation?
Inverse variation describes a relationship between two variables where one variable increases as the other decreases. This is different from direct variation, where both variables change in the same direction.
For two variables and , if where is a positive constant, we say that " varies inversely as ". This can also be expressed as " is inversely proportional to ".
Notation: We write this relationship symbolically as:
The positive constant is called the constant of variation.
Key characteristic: As increases, decreases, and vice versa. This opposite relationship is the defining feature of inverse variation.
For example, if , then and 3 is the constant of variation.
Understanding inverse variation through a real-world example
Real-World Example: Bricklayers Building a Wall
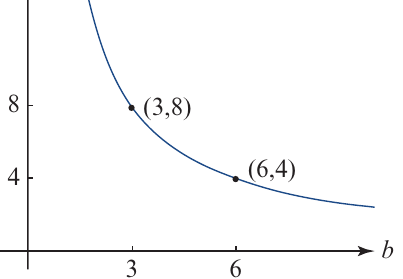
Consider a builder who employs bricklayers to build a wall. If three bricklayers can complete the wall in 8 hours, what happens when six bricklayers are employed? The wall will be completed in half the time (4 hours). The more bricklayers employed, the shorter the time taken to complete the wall.
In this scenario:
- Time taken () decreases as the number of bricklayers () increases
- We say: varies inversely as , or is inversely proportional to
- We write:
The graph of this relationship shows the characteristic curve of inverse variation:
Recognizing inverse variation from tables
When working with data in table form, inverse variation can be identified by checking if the product of corresponding values remains constant.
Important property: If , then for a positive constant .
This means the product is always constant, which is a useful way to check for inverse variation.
Example:
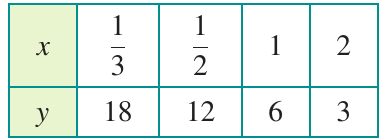
In this table, and the constant of variation is 6. We can verify this:
- When , , so
- When , , so
- When , , so
- When , , so
Therefore, we can say that .
Graphical representation of inverse variation
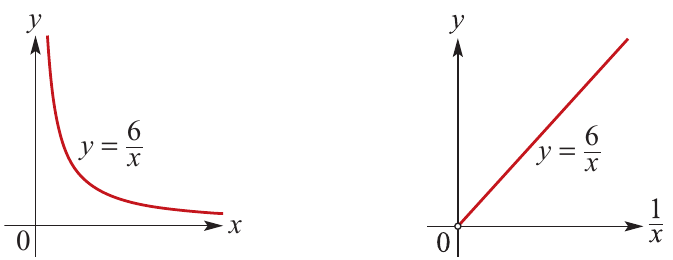
When we plot the graph of against for inverse variation, we obtain a curved shape called a hyperbola. This curve shows a downward trend as increases.
However, if we plot the graph of against , we get a straight line. This line does not pass through the origin because is undefined when .
Important note: Not all decreasing trends represent inverse variation. To confirm inverse variation, you must verify that the product remains constant.
Finding the constant of variation
To work with inverse variation problems, you often need to find the constant of variation . Here's the systematic approach:
Method:
- Write the variation expression:
- Rewrite as an equation:
- Substitute known values of and
- Solve for
- Check your answer with other values if available
Worked example: determining the constant from a table
Worked Example: Determining the Constant from a Table
Question: Use the table of values to find the constant of variation, , and complete the table.
| 1 | 2 | 3 | 4 | ||
|---|---|---|---|---|---|
| 3 | 1 | 0.75 | 0.6 |
Solution:
Write the variation expression:
Rewrite as an equation with constant of variation:
Substitute known values. When , :
Solve for :
Write the equation:
Check with another value. When :
Find the missing value. When :
Find the missing value. When :
Complete table:
| 1 | 2 | 3 | 4 | 5 | |
|---|---|---|---|---|---|
| 3 | 1.5 | 1 | 0.75 | 0.6 |
Solving practical inverse variation problems
Many real-world situations involve inverse variation. Here's how to approach these problems systematically.
Worked example: cylinder problem
Worked Example: Cylinder Problem
Question: For a cylinder of fixed volume, the height ( cm) is inversely proportional to the square of the radius ( cm).
If a cylinder of height 15 cm has a base radius of 4.2 cm, how high would a cylinder of equivalent volume be if its radius was 3.5 cm?
Solution:
Write the variation expression and equation:
Substitute known values. When , :
Write the equation:
Find the height when radius is 3.5 cm:
Answer: A cylinder with radius 3.5 cm has a height of 21.6 cm.
Key properties of inverse variation
Understanding these properties will help you work confidently with inverse variation:
- Equation form: If varies inversely as , then for some positive constant
- Proportionality notation: We write
- Constant product: If , then for any two pairs of values
- Graphical representation: The graph of against is a straight line (not defined at the origin), and the gradient equals the constant of variation
- Opposite direction: As one variable increases, the other decreases
These properties provide multiple ways to identify and work with inverse variation. When solving problems, you can use whichever property is most convenient for the given situation.
Remember!
Key Points to Remember:
- Inverse variation means one variable increases while the other decreases, following the relationship
- The constant of variation () stays the same throughout the relationship, and can be found by calculating for any pair of values
- The graph of against forms a hyperbola (curved shape), while the graph of against is a straight line
- To solve inverse variation problems: write the equation , find using known values, then use the equation to find unknown values
- Check for inverse variation by verifying that the product remains constant for all data pairs