Morbidity and Burden of Disease (VCE SSCE Health and Human Development): Revision Notes
Morbidity and Burden of Disease
Understanding morbidity
Not all health conditions result in death, which is why it's important to examine how non-fatal conditions affect young people's health and wellbeing. This is where morbidity data becomes valuable.
Morbidity refers to ill health in an individual and the levels of ill health within a population. This includes disease, injury and disability. The morbidity rate measures the rate of ill health in a population during a given period.
Morbidity is distinct from mortality - while mortality focuses on deaths, morbidity examines the non-fatal health conditions that affect people's quality of life and wellbeing.
There are two main ways to measure morbidity:
- The number or rate of people reporting a condition (shown as percentages, incidence rates, or prevalence rates)
- Years lost due to disability (YLD), where one YLD equals one 'healthy' year of life lost due to living with disease, injury or disability
By using both methods, we can identify which conditions are most common and which have the biggest impact on health and wellbeing among Australian youth.
Incidence and prevalence of health conditions
What are incidence and prevalence?
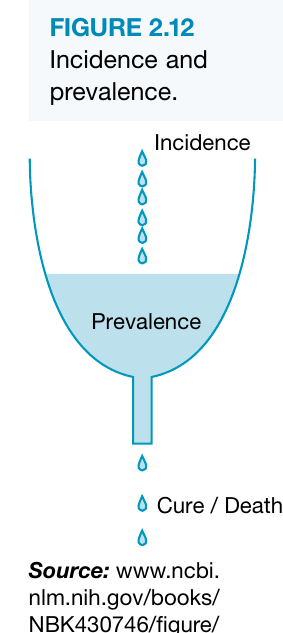
Incidence refers to the number (or rate) of new cases of a disease or condition in a population during a given period, usually 12 months. Think of incidence as the new cases flowing into the population.
Prevalence refers to the total number or proportion of cases of a particular disease or condition present in a population at a given time. Prevalence represents all existing cases at one point in time.
Both can be expressed as total numbers or as rates (typically per 1,000 or per 100,000 population).
Remembering the Difference:
Think of incidence as "IN-coming" - new cases entering the population. Think of prevalence as "PRESENT-alence" - cases currently present.
The relationship can be visualised as a funnel: new cases (incidence) flow in from the top, accumulate as total cases (prevalence) in the middle, and exit through cure or death at the bottom.
Why this matters
Incidence data helps identify which conditions are increasing or decreasing in diagnosis. This assists governments and health organisations in allocating resources and taking action to improve youth health status. Prevalence data reveals how many individuals are currently suffering from conditions, helping with resource allocation and future planning.
Common health conditions among Australian youth
The table below shows estimated incidence rates (new cases per 1,000 population) for selected conditions among Australian youth in 2019:
| Condition | Males 10-14 | Males 15-19 | Females 10-14 | Females 15-19 |
|---|---|---|---|---|
| Asthma | 6.9 | 3.4 | 6.9 | 4.9 |
| Migraine | 16.5 | 12.7 | 26.5 | 24.3 |
| Anxiety and depression | 24.1 | 53.7 | 41.3 | 96.9 |
| Eating disorders | 8.1 | 19.3 | 8.5 | 18.4 |
| Back and neck pain | 14.0 | 19.7 | 17.1 | 25.1 |
| Dental caries | 428.9 | 519.3 | 437.1 | 520.4 |
Key patterns from this data:
- Anxiety and depression show notably high incidence rates, particularly among females aged 15-19 (96.9 per 1,000)
- Dental caries has the highest incidence rates across all groups
- Most conditions show higher rates in the older age group (15-19 years)
- Females generally experience higher rates than males for most conditions
Understanding these health conditions
| Condition | Description |
|---|---|
| Asthma | When exposed to triggers (such as cigarette smoke or air pollution), the airway lining becomes inflamed and swollen, extra mucus is produced, and airway muscles tighten (bronchoconstriction). This narrows the airways, making breathing difficult. |
| Migraine | A neurological condition characterised by severe, throbbing headaches usually on one side of the head. Attacks can last from four hours to three days and are linked to spasms in blood vessels leading to the brain. They may occur infrequently or several times per week. |
| Anxiety and depression | Anxiety involves extreme worry that interferes with daily life, including panic attacks, physical fear reactions and avoidance behaviours. Depression involves constant feelings of sadness and loss of interest in normal activities without an identifiable reason. |
| Eating disorders | Mental illnesses including anorexia nervosa (restricted eating, weight loss, fear of weight gain), bulimia nervosa (binge eating followed by compensatory behaviours like over-exercising or vomiting), and binge eating disorder (uncontrolled eating episodes followed by guilt and distress). |
| Back and neck pain | Common among youth, often caused by poor posture, inappropriate exercise techniques, and carrying heavy schoolbags. |
| Dental caries | Also known as cavities or tooth decay, dental caries occur when tooth enamel breaks down due to excess acid in the mouth. |
Calculating total cases and rates
Understanding how to calculate incidence and prevalence rates is essential for interpreting health data. The formulas are:
Worked Example: Calculating Total New Cases
In 2019, there were approximately 799,100 males aged 10-14 years. The incidence rate for asthma was 6.9 per 1,000. To calculate total new cases:
Step 1: Divide population by 1,000
Step 2: Multiply by the rate
Answer: Approximately 5,513 males aged 10-14 were newly diagnosed with asthma in 2019.
Worked Example: Calculating Prevalence Rates
If there were 756,700 females aged 10-14 and 83,497 had asthma:
Step 1: Divide population by 1,000
Step 2: Divide total cases by this number
Answer: The prevalence rate is 110.3 cases per 1,000 females aged 10-14.
Prevalence data for selected conditions
The total number of cases (prevalence) for selected conditions in 2019:
| Condition | Males 10-14 | Males 15-19 | Females 10-14 | Females 15-19 |
|---|---|---|---|---|
| Asthma | 93,167 | 70,808 | 83,497 | 78,041 |
| Migraine | 68,041 | 87,662 | 85,606 | 136,670 |
| Anxiety and depression | 11,726 | 28,311 | 18,506 | 47,235 |
| Eating disorders | 1,644 | 5,856 | 4,687 | 18,290 |
| Back and neck pain | 19,818 | 37,283 | 22,384 | 43,828 |
| Dental caries | 175,180 | 202,670 | 72,405 | 196,332 |
Prevalence rates per 1,000 population for the same conditions:
| Condition | Males 10-14 | Males 15-19 | Females 10-14 | Females 15-19 |
|---|---|---|---|---|
| Asthma | 116.6 | 91.9 | 110.3 | 107.1 |
| Migraine | 76.4 | 113.7 | 113.1 | 187.6 |
| Anxiety and depression | 14.7 | 36.7 | 24.5 | 64.8 |
| Eating disorders | 2.1 | 7.6 | 6.2 | 25.1 |
| Back and neck pain | 24.8 | 48.4 | 29.6 | 60.1 |
| Dental caries | 219.2 | 262.9 | 227.8 | 269.4 |
Years lost due to disability (YLD)
What is YLD?
Years lost due to disability (YLD) measures the impact of morbidity on a group or population. While YLL (years of life lost) measures healthy years lost due to premature death, YLD measures healthy years lost because of living with illness, disease or disability.
Both measures are equal in value: one YLL and one YLD each equal one healthy year of life lost. This equality allows for fair comparison between fatal and non-fatal health conditions.
Disability weights: making fair comparisons
Different conditions affect people in different ways. For example, asthma's impact differs significantly from losing a leg in a car crash. To address this challenge, the World Health Organization (WHO) has assigned disability weights to common conditions.
These weights indicate:
- The severity of the condition
- How much it interferes with normal life
Disability weights are incorporated into YLD calculations, allowing fair comparisons between different conditions. For instance, even though headaches are more common among youth than asthma, headaches are considered less severe. This means asthma contributes more YLD and is therefore considered a greater health concern.
YLD patterns by age and gender
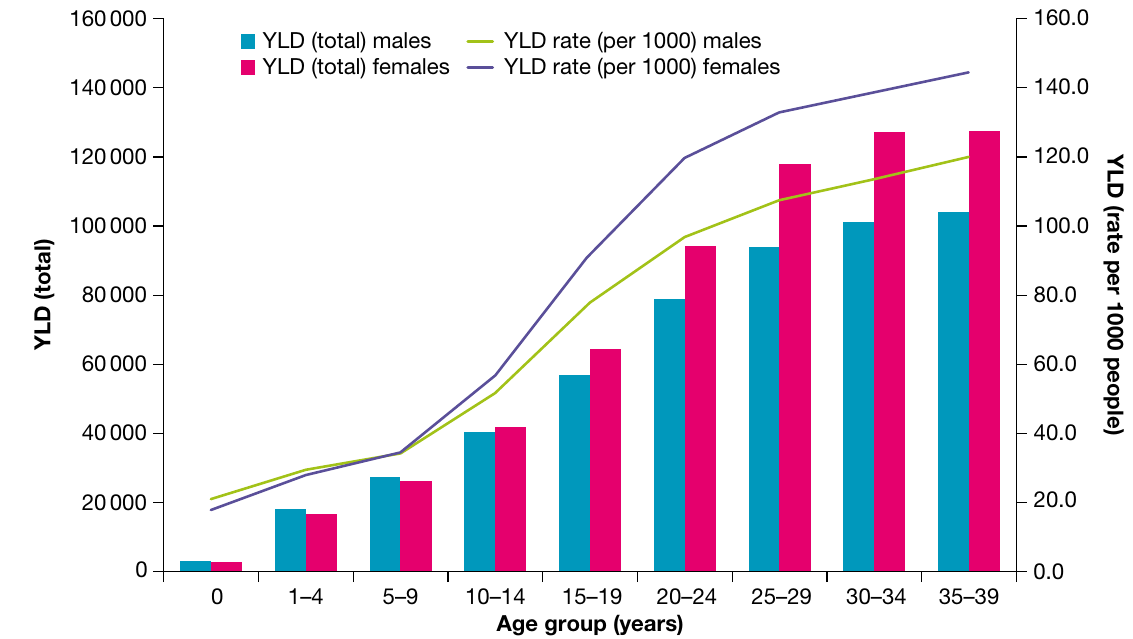
This graph shows that:
- Males experience slightly more YLD than females up to age 5-9
- Females experience greater YLD numbers and rates in both 10-14 and 15-19 age groups
- The increase in mental disorders among females in these age groups is largely responsible for this change
- Both total YLD and YLD rates increase progressively with age
Leading causes of YLD among youth
For 10- to 14-year-olds:
The breakdown shows:
- Mental and substance use disorders: 33.18% (largest contributor)
- Skin disorders: 14.29%
- Injuries: 12.12%
- Respiratory diseases: 9.19%
- Diseases of the nervous system: 8.82%
- Musculoskeletal conditions: 5.9%
- All other diseases: 16.5%
For 15- to 19-year-olds:
The breakdown shows:
- Mental and substance use disorders: 42.46% (even more dominant)
- Injuries: 10.64%
- Musculoskeletal conditions: 10.11%
- Skin disorders: 9.73%
- Diseases of the nervous system: 8.41%
- Respiratory diseases: 5.19%
- All other diseases: 13.46%
Mental health conditions become increasingly significant in the older age group, nearly doubling their contribution to YLD. This highlights the critical importance of mental health support and intervention programs for youth, particularly in the 15-19 age range.
Key conditions contributing to YLD
| Condition | Description |
|---|---|
| Mental and substance use disorders | Include depression, anxiety, eating disorders, and alcohol and drug use disorders. These are the largest contributor to YLD among youth, indicating they have the greatest non-fatal impact on health status. These conditions are both common and can be quite severe. |
| Skin disorders | The third leading contributor to YLD, including acne, eczema, psoriasis and other forms of dermatitis (conditions causing skin irritation, inflammation, itching, dryness or rashes). These conditions are often long-lasting and can be severe. |
| Musculoskeletal conditions | Affect bones, muscles and connective tissues. Common examples include juvenile arthritis (joint pain and swelling in those under 16), back problems (affecting bones, joints, tissues, muscles and nerves), and joint reconstruction surgery (such as shoulder and knee reconstruction). |
| Respiratory diseases | Asthma and bronchitis account for the majority of YLD from respiratory conditions. Although more youth experience asthma than mental disorders, asthma is considered less severe and therefore contributes fewer YLD. |
Dermatitis refers to conditions characterised by irritation and/or inflammation of the skin, usually involving itchy, dry skin or rashes on swollen, reddened skin.
Burden of disease
Understanding burden of disease and DALY
Burden of disease is a concept that combines mortality data with morbidity data, allowing conditions that contribute differently to death and illness to be compared fairly. For example, cancer causes significant death and illness, while chronic conditions like asthma cause substantial illness but less death. Previously, comparing these conditions was difficult, making funding decisions challenging. Burden of disease data helps overcome this problem.
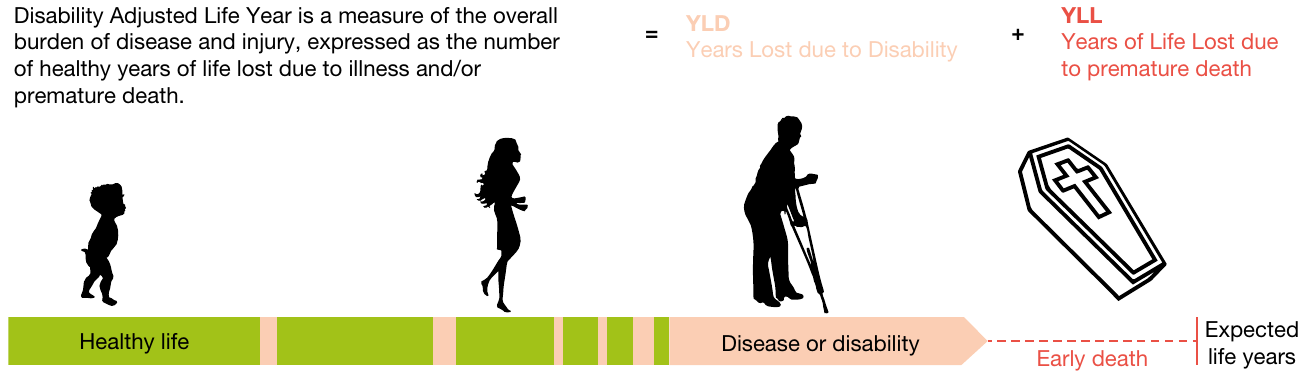
Burden of disease is measured in disability adjusted life years (DALY), where 1 DALY equals one year of healthy life lost due to premature death and time lived with illness, disease or injury.
The DALY Formula:
Where:
- YLD = Years lost due to disability (non-fatal impact)
- YLL = Years of life lost (fatal impact)
Using DALY, we can equally compare:
- Conditions that cause death
- Conditions that cause disability and illness
- Conditions that cause both
Understanding DALY in Practice:
Think of DALY as "Disability And Life Years" - it combines both disability (YLD) and life years lost (YLL) into a single, comprehensive measure of disease burden.
Examples of DALY in practice
- A person who lived a healthy life but dies suddenly 30 years earlier than expected life expectancy contributes 30 DALY
- A person still alive but who has spent their last 10 years at only 'half health' contributes 5 DALY
Although ill health generally has greater effects towards the end of life, YLD can be contributed at any stage of life.
Leading causes of burden among youth
The ten leading causes of burden of disease and injury for 10- to 19-year-olds in Australia (2019):
| Condition | 10-14 years DALY | % of total | 15-19 years DALY | % of total |
|---|---|---|---|---|
| Mental and substance use disorders | 26,831 | 29.0% | 52,696 | 34.7% |
| Injuries | 14,083 | 15.2% | 33,482 | 22.1% |
| Skin disorders | 11,708 | 12.6% | 11,760 | 7.7% |
| Neurological conditions | 7,969 | 8.6% | 11,375 | 7.5% |
| Respiratory diseases (including asthma) | 7,967 | 8.6% | 6,747 | 4.4% |
| Musculoskeletal conditions | 4,905 | 5.3% | 12,335 | 8.1% |
| Infectious diseases | 3,762 | 4.1% | 3,689 | 2.4% |
| Cancer | 2,952 | 3.2% | 3,843 | 2.5% |
| Infant and congenital conditions | 2,103 | 2.3% | 1,944 | 1.3% |
| All other conditions | 10,348 | 11.2% | 13,929 | 9.2% |
Key patterns:
- Mental and substance use disorders are the leading cause in both age groups
- The burden from mental health increases with age (29% to 34.7%)
- Injuries become more significant in the older age group (15.2% to 22.1%)
- Musculoskeletal conditions nearly double in burden for older youth
Additional condition definitions
Neurological disorders common among youth include migraine and headache disorders, as well as epilepsy (a condition characterised by seizures caused by disrupted electrical activity in the brain).
Infectious diseases include respiratory infections, meningococcal infections, food poisoning, and sexually transmissible infections such as chlamydia, syphilis and gonorrhoea.
Infant and congenital conditions first occur before or just after birth, including:
- Down syndrome (genetic condition with three chromosomes on the 21st pair, causing distinct facial features, reduced muscle mass and impaired intelligence)
- Muscular dystrophy (progressive and irreversible muscle weakness and wasting)
- Birth defects (missing or ill-formed body structures with genetic, infectious or environmental origins)
YLD versus YLL among youth
In 2019, Australian youth aged 10-19 experienced:
- 202,944 YLD
- 41,484 YLL
- Total: 253,975 DALY
This demonstrates that young people experience significantly more disability and illness (YLD) than premature death (YLL). Non-fatal conditions have a greater impact on youth health than mortality.
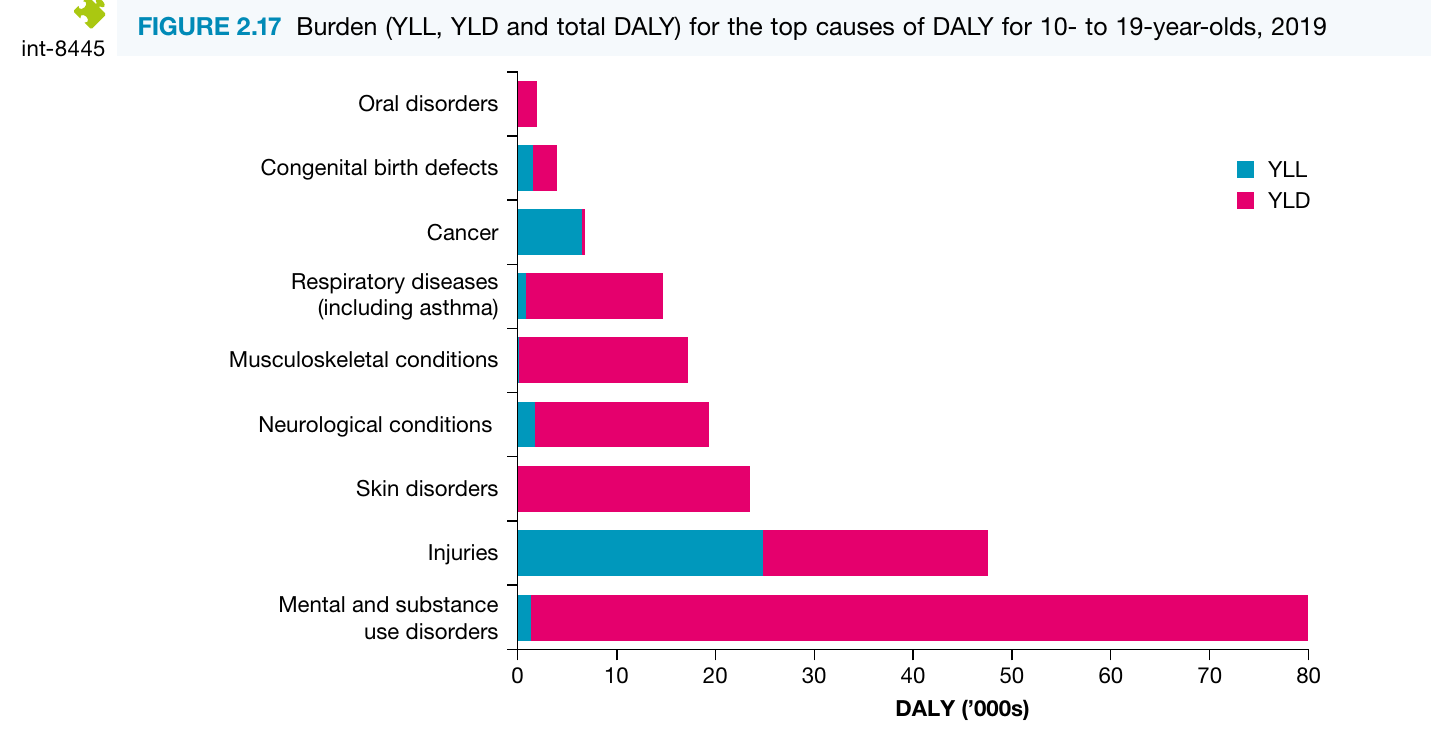
This breakdown chart shows:
- Mental and substance use disorders contribute almost entirely YLD (pink bars), with minimal YLL (blue bars)
- Injuries show a more balanced contribution of both YLD and YLL
- Most conditions contribute primarily through disability rather than death
- The combined burden emphasises the importance of both preventing death and managing chronic conditions
Case study: ACL injuries among Australian youth
An epidemic of anterior cruciate ligament (ACL) injuries demonstrates the burden of musculoskeletal conditions among young Australians. Key findings include:
The problem:
- Australia has the world's highest rates of ACL reconstructions
- Injuries are occurring in increasingly younger athletes, some as young as 7 or 8
- Nearly 200,000 ACL reconstructions performed in 15 years to 2015
- 74% increase in reconstructions among those under 25
- Biggest increase in children aged 5-14: 8.8% annual growth for girls, 7.7% for boys
Repeat injuries:
- Among 128 young people who had two ACL surgeries, almost 30% had a third injury
- This high rate raises concerns for future knee health
Potential Causes of the ACL Epidemic:
- Lack of 'free play' in children focused on electronic devices
- Early specialisation in individual sports
- Insufficient agility training and warm-up techniques
Long-term effects:
- Future knee reconstructions
- Debilitating pain through osteoarthritis
- Need to switch to lower-risk sports
Prevention:
- Many ACL injuries are preventable with proper agility training
- Proposed national prevention program costing $2-3 million
- Teaching volunteer coaches effective warm-up techniques
- Estimated to be cost-effective given surgery costs $142 million annually
This case study illustrates how a single type of injury can significantly contribute to the burden of disease among youth through both immediate disability and long-term health consequences. It also demonstrates the importance of prevention strategies in reducing disease burden.
Study tip: using correct units of measurement
When analysing or explaining burden of disease data, always use correct units of measurement. In the chart showing DALY by cause, the numbers are shown in thousands (represented by '000s). Therefore:
- Mental and substance use disorders contribute approximately 80,000 DALY (not 80 DALY)
- Injuries contribute approximately 48,000 DALY
- Always check the scale and units on graphs and tables
Key Points to Remember:
- Morbidity measures ill health in populations, including disease, injury and disability, not just deaths
- Incidence tracks new cases entering a population ("IN-coming"), while prevalence tracks total existing cases at a point in time ("PRESENT-alence")
- YLD (years lost due to disability) quantifies healthy years lost due to living with illness, using disability weights to fairly compare different conditions
- DALY combines mortality (YLL) and morbidity (YLD) data:
- Mental and substance use disorders are the leading cause of both YLD and DALY among Australian youth, contributing over 40% of burden in 15-19 year olds
- Australian youth experience significantly more YLD than YLL, meaning non-fatal conditions have greater impact than premature death on this age group