Mortality (VCE SSCE Health and Human Development): Revision Notes
Mortality
Introduction to mortality
When we talk about mortality, we're referring to death within a population. Understanding mortality patterns among Australian youth helps us identify health risks and plan effective interventions.
There are two main ways to measure mortality:
- Mortality rate - the number or rate of deaths in a population, usually presented per 100,000 population in a 12-month period
- Years of life lost (YLL) - where one YLL equals one year of life lost due to premature death
Both measures provide valuable insights, but they tell us slightly different things about the health status of young Australians.
Understanding mortality is crucial for public health planning. By identifying when, how, and why young people die, health authorities can develop targeted prevention programs and allocate resources to areas where they will have the greatest impact on saving lives.
Key definitions
Mortality: The number of deaths in a population in a given period.
Years of life lost (YLL): A measure of how many years of expected life are lost due to premature death.
Mortality rate
What is a mortality rate?
A mortality rate shows how many deaths occurred in a population during a specific time period, usually one year. Rather than just counting total deaths, mortality rates are expressed per 100,000 population. This allows for fair comparisons between different groups of people.
Mortality rates can be calculated for:
- Specific age groups (e.g., 15-19 year olds)
- Different sexes (males vs females)
- Particular causes of death (e.g., road accidents, cancer)
- All causes combined
How to interpret mortality rates
Understanding mortality rates involves looking at the numbers in context. For example, a mortality rate of 20.1 per 100,000 for females aged 15-19 means that on average, 20.1 females in every 100,000 died in one year. If there were approximately 730,000 females in this age group, this would equal about 147 deaths.
The male
ratio is another important measure. A ratio of 2.0 means that for every female who died in that age group, an average of 2.0 males died. This indicates that males were twice as likely to die compared to females at that age.Worked Example: Interpreting the Male
RatioIf in 2019 the mortality rate for males aged 15-19 was 40.2 per 100,000 and for females was 20.1 per 100,000:
Step 1: Calculate the ratio
Step 2: Interpret the result This means that in 2019, an average of 2.0 males died in this age group for every female that died in this age group, meaning that males were twice as likely to die at this age compared to females.
Understanding mortality rates: An important exam tip
When comparing mortality between different population groups, it's critical to use rates rather than raw numbers of deaths. This is because different groups have different population sizes, which can create misleading comparisons.
Common exam mistake: Students often compare total death numbers between Indigenous and non-Indigenous populations without considering population size differences. This leads to incorrect conclusions about health disparities.
Let's look at an example comparing Indigenous and non-Indigenous Australians aged 15-24 in 2018:
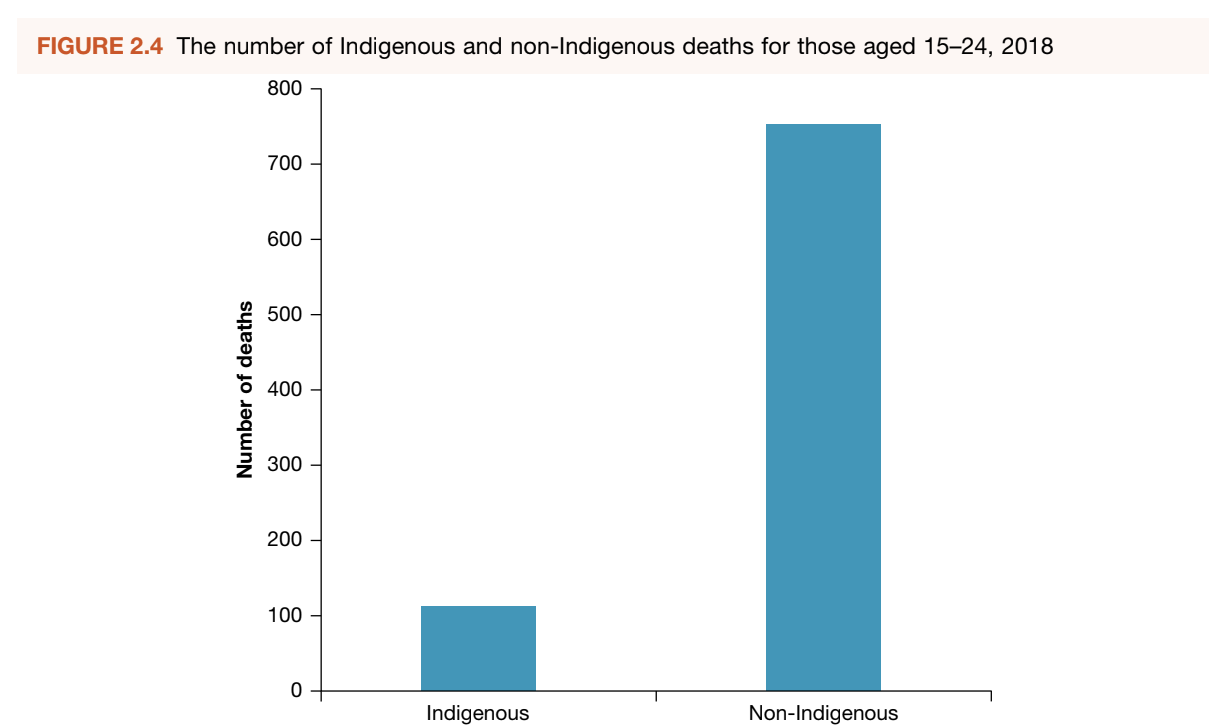
If we just look at the total number of deaths, it appears that Indigenous youth are better off, with around 113 deaths compared to around 753 deaths for non-Indigenous youth. However, this comparison is unfair because it doesn't account for the fact that there are far more non-Indigenous people in Australia than Indigenous people.
When we calculate the rate per 100,000 population, we get a very different picture:
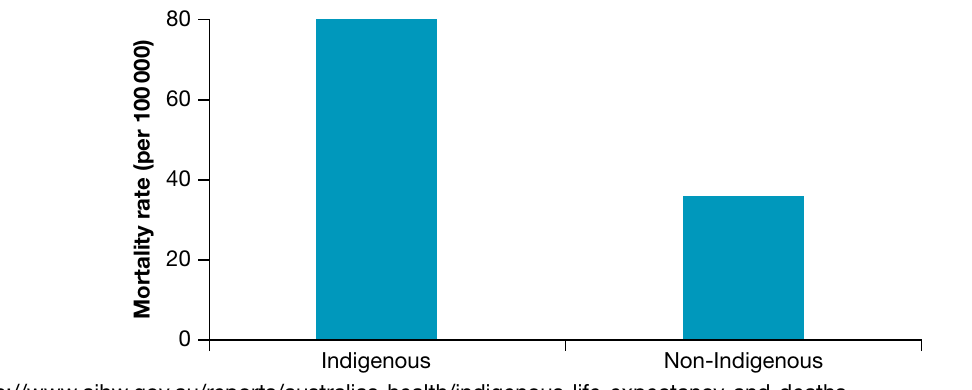
The mortality rate for non-Indigenous youth aged 15-24 is approximately 35 deaths per 100,000 people, whereas for Indigenous youth the rate is approximately 80 deaths per 100,000 people. This shows that Indigenous young people actually experience mortality rates more than double those of non-Indigenous young people - a significant health disparity that would be hidden if we only looked at total numbers.
Exam tip: Always check the vertical axis on graphs carefully. Make sure you understand whether you're looking at total numbers or rates per population before drawing conclusions about health outcomes.
Mortality rates among youth compared to other age groups
Youth (aged 10-24) experience among the lowest mortality rates of all life stages, second only to childhood (aged 5-9).
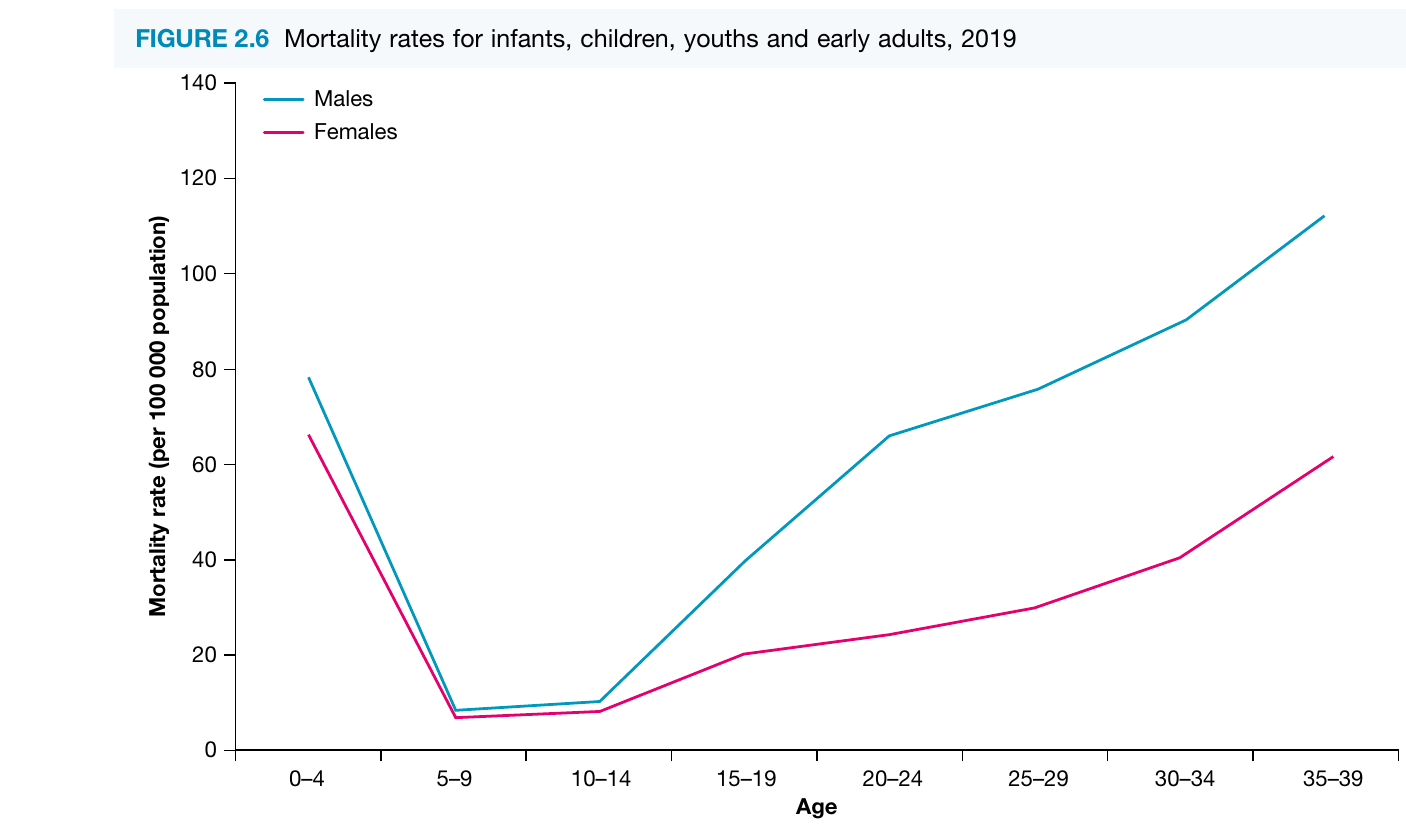
This graph clearly shows the U-shaped pattern of mortality across the lifespan. The highest mortality rates occur in infancy (0-4 years), then rates drop dramatically during childhood (5-9 years), remain low through the youth years (10-19), and then gradually increase through adulthood.
Key observations:
- Males have consistently higher mortality rates than females across all age groups
- The gender gap in mortality widens significantly during the youth years, particularly from ages 15-19 onwards
- By ages 35-39, males have a mortality rate of approximately 112 per 100,000 compared to about 62 per 100,000 for females
- The lowest mortality rates occur between ages 5-14
Trends in youth mortality over time
Mortality rates among young Australians have decreased significantly over the past few decades. This is excellent news and reflects improvements in healthcare, education, safety measures and technology.
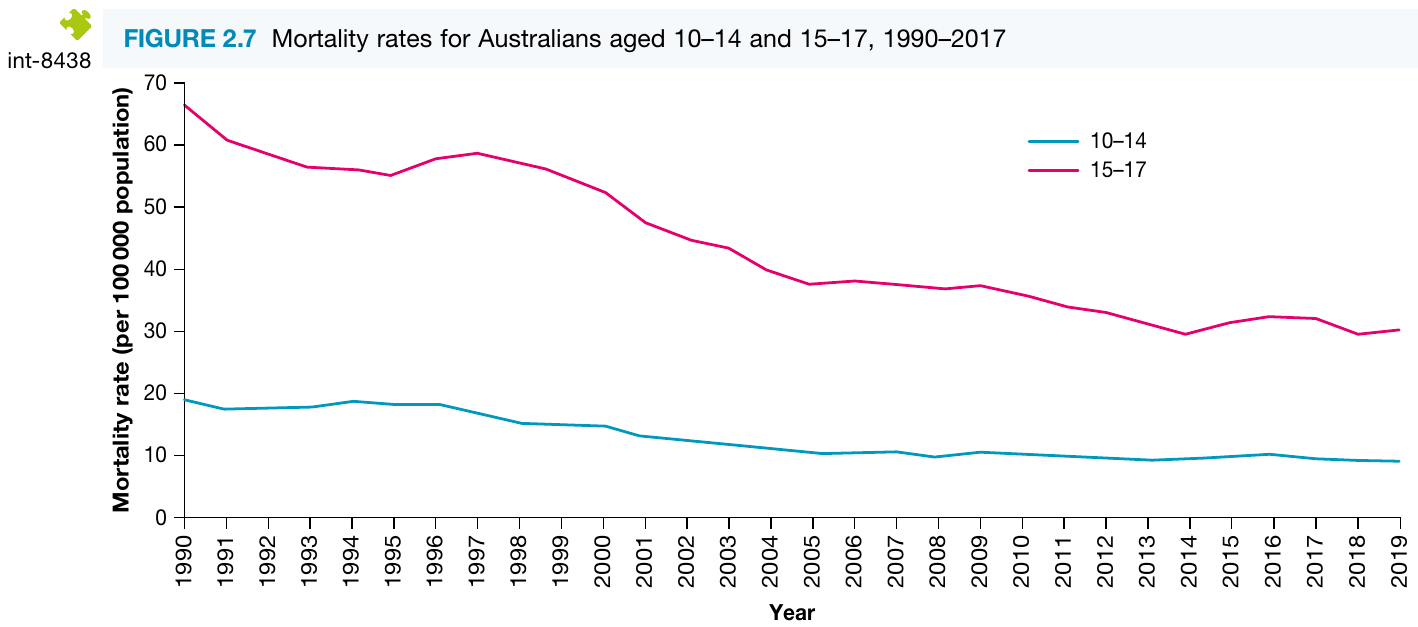
This graph shows clear downward trends for both age groups:
- In 1990, the mortality rate for 15-17 year olds was approximately 67 per 100,000
- By 2019, this had decreased to around 30 per 100,000
- For 10-14 year olds, rates decreased from approximately 19 per 100,000 in 1990 to around 9 per 100,000 in 2019
What caused these improvements?
- Advances in medical treatment and emergency care
- Better road safety measures and vehicle safety features
- Improved education about health risks
- Better prevention programs for common causes of death
- Technological improvements in healthcare delivery
Understanding trends: A trend is a general movement or pattern over time. Trend data is valuable because it helps us understand whether health outcomes are improving or worsening. Even though a mortality rate of 30 per 100,000 for 15-19 year olds might seem high, trend data shows this is actually a significant improvement compared to previous decades.
Why youth mortality rates are low
Young people aged 10-24 have relatively low mortality rates compared to other life stages for several important reasons:
1. They have survived the risks of early childhood
The main causes of death in infancy and early childhood include complications from childbirth, congenital abnormalities, and genetic conditions. By the time someone reaches youth, they have already survived these early-life risks.
2. Lifestyle factors haven't had time to cause damage
Many of the major killers in adulthood - such as heart disease, type 2 diabetes, and lung cancer - develop over many years of unhealthy lifestyle choices. During youth, factors like poor diet, smoking, excessive alcohol consumption, and physical inactivity generally haven't had enough time to cause serious health conditions leading to death.
3. Generally healthy and resilient
Youth is a period of peak physical capability, with strong immune systems and good recovery abilities.
However, it's important to note that while overall mortality is low, certain causes of death are particularly significant for this age group, which we'll explore in the next section.
Leading causes of death among youth
Although mortality rates are relatively low during youth, when deaths do occur, they tend to be from specific causes. Understanding these leading causes helps identify where prevention efforts should focus.
The four main causes of mortality among Australian youth aged 10-19 are:
- Injuries and poisoning (the leading cause)
- Cancers (second leading cause)
- Diseases of the nervous system (third leading cause)
- Cardiovascular diseases (less common but still significant)
Let's examine each of these in detail:
Injuries and poisoning
| Cause of mortality | Description | Specific links to youth |
|---|---|---|
| Injuries and poisoning | Injuries relate to physical trauma or damage caused to body tissues by an external force. Specifically, injuries include road accidents, intentional self-harm, drowning and violence. Poisoning occurs when a substance interferes with normal body functions after it is swallowed, inhaled, injected or absorbed. | Deaths from accidental causes such as car accidents and drowning contribute significantly to mortality rates during the youth stage. Common causes of poisoning among youth include drug overdoses and alcohol poisoning. |
Why this matters for youth: Young people, particularly those aged 15-24, are more likely to engage in risk-taking behaviours including:
- Learning to drive and driving inexperienced or taking risks on the road
- Experimenting with alcohol and drugs
- Engaging in activities near water
- Participating in contact sports or extreme activities
Males are particularly at risk, with much higher rates of injury-related deaths than females.
Cancers
| Cause of mortality | Description | Specific links to youth |
|---|---|---|
| Cancers | Cancer is characterised by the uncontrolled growth of abnormal cells. These cells can interfere with healthy cells and prevent them from carrying out their normal functions. Although the mortality rate associated with cancer is relatively low among youth compared to other lifespan stages, it is still the second leading cause of mortality for this group. | Among youth, the most common cancers include: - Melanoma - cancer of the melanocytes, a type of skin cell - Hodgkin lymphoma - a form of blood cancer - Testicular cancer - cancer of the testicles, therefore affecting only males |
Why this matters for youth: While cancer is less common in young people than in older adults, when it does occur during youth it has a significant impact. Australia has high rates of skin cancer due to our climate and outdoor lifestyle, making melanoma a particular concern. Early detection and treatment are crucial for improving survival rates.
Diseases of the nervous system
| Cause of mortality | Description | Specific links to youth |
|---|---|---|
| Diseases of the nervous system | Diseases of the nervous system were the third most common cause of death among youth in 2019. The nervous system is made up of the brain, spinal cord and nerves. | Diseases affecting these structures in youth include: - Cerebral palsy - a condition caused by damage to the brain that occurs either during pregnancy or shortly after birth - Epilepsy - a brain condition characterised by recurrent seizures - Muscular dystrophy - a range of related conditions that cause progressive weakness and loss of muscle mass |
Why this matters for youth: Many nervous system conditions that cause death during youth are congenital (present from birth) or develop in early childhood. These conditions can be progressive, meaning they worsen over time, or they can cause sudden fatal events such as seizures or respiratory failure.
Cardiovascular diseases
| Cause of mortality | Description | Specific links to youth |
|---|---|---|
| Cardiovascular diseases | Cardiovascular disease refers to diseases of the heart and blood vessels. | This cause of death is not common in young people, and when cardiovascular-related deaths do occur in youth, they usually arise from heart defects and genetic conditions. |
Why this matters for youth: Unlike in older adults where cardiovascular disease usually results from lifestyle factors (poor diet, smoking, lack of exercise), cardiovascular deaths in youth are typically due to structural problems with the heart that are present from birth or genetic conditions affecting the heart muscle or rhythm. Some of these may not be detected until physical exertion triggers a fatal event.
Gender differences in mortality causes
Males experience higher mortality rates than females across nearly all causes of death. The gender gap is particularly pronounced for injuries and poisoning, where males aged 15-19 have mortality rates approximately twice as high as females of the same age.
This difference is largely explained by:
- Higher rates of risk-taking behaviour among males
- Greater involvement in dangerous activities and situations
- Higher rates of substance use and abuse
- Greater likelihood of involvement in violence
Years of life lost (YLL)
What is YLL?
Years of life lost (YLL) is another way of measuring mortality that takes into account not just whether someone died, but how many years of potential life they lost. One YLL equals one year of life lost due to premature death.
How YLL is calculated: If a person dies from a condition before their predicted life expectancy for their age, the difference between their age at death and their expected lifespan is counted as YLL.
Worked Example: Calculating Years of Life Lost
If a 15-year-old female dies in a car crash, and the life expectancy for females at that age is 85 years:
Step 1: Identify the values
- Current age at death = 15 years
- Life expectancy = 85 years
Step 2: Calculate YLL
Step 3: Interpret the result This means 70 years have been added to the YLL total for injuries. This single death represents 70 years of potential life lost.
Why YLL matters: YLL gives us a different perspective on health priorities. A condition that kills relatively few people but kills them young can have a high YLL burden. This helps health planners understand where interventions might have the greatest impact in terms of preserving years of life.
YLL among youth compared to other age groups
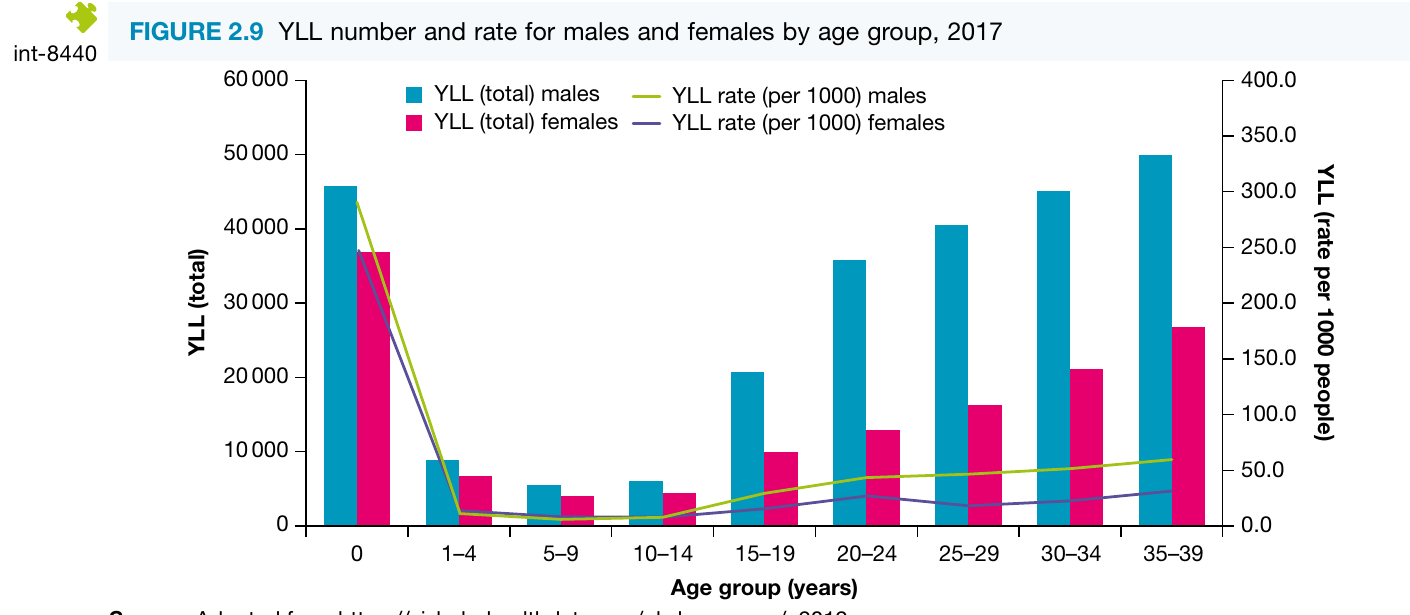
This graph shows both the total YLL (shown as bars) and the rate of YLL per 1,000 people (shown as lines) for different age groups in 2017.
Key observations:
- Infants (age 0) have the highest total YLL because each infant death represents 80+ years of potential life lost
- Youth aged 10-19 have relatively low total YLL compared to other age groups
- However, the rate of YLL per 1,000 people is still significant during youth
- Males experience higher YLL than females across all youth age groups
- The gender gap in YLL widens considerably during late adolescence and early adulthood
Even though youth have low mortality rates overall, when deaths do occur during this life stage, many years of potential life are lost. This makes prevention of youth deaths particularly important from a public health perspective.
Leading causes of YLL among youth
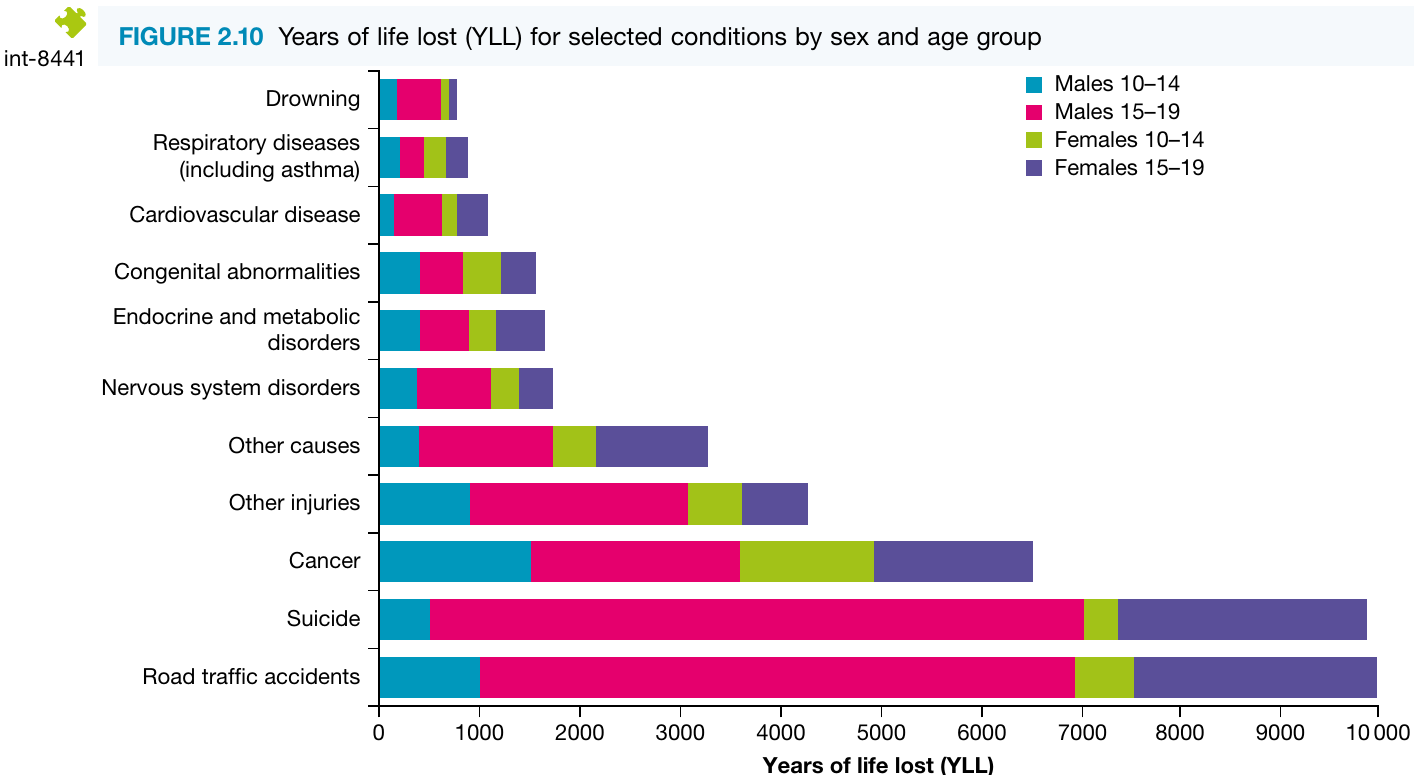
This detailed breakdown shows which conditions contribute most to YLL among young Australians aged 10-19, separated by sex and age group.
Key findings:
1. Road traffic accidents are the leading specific cause of YLL among Australian youth, contributing approximately 9,000-10,000 years of life lost. Males aged 15-19 are particularly affected.
2. Suicide is the second leading cause of YLL, with a burden similar to road traffic accidents. Again, males aged 15-19 contribute the largest proportion.
3. Cancer is the third leading cause of YLL and the leading non-injury related cause.
4. Injury-related deaths account for three of the top four causes of YLL: road traffic accidents, suicide, and other injuries. This highlights that preventable injuries are the major contributor to premature death during youth.
5. Nervous system disorders (including epilepsy and muscular dystrophy) follow cancer as the fourth leading contributor.
6. The remaining causes (cardiovascular disease, respiratory diseases, drowning, etc.) each contribute relatively small amounts to overall YLL.
Important distinction: The category 'Other causes' is not considered a leading cause of death because it encompasses many different conditions, each of which individually contributes very few YLL.
Gender and age patterns in YLL
The data clearly shows that:
- Males aged 15-19 experience by far the highest YLL burden across almost all causes, particularly for road traffic accidents and suicide
- Females aged 15-19 have the second highest YLL burden, but it is considerably lower than males of the same age
- Younger youth (10-14 year olds) of both sexes contribute much less to YLL totals than older youth (15-19 year olds)
- The gender gap in YLL is most pronounced for injury-related causes
This pattern reflects the increased independence, mobility (including driving), and risk-taking behaviour that characterises the 15-19 age group, particularly among males.
Remember!
Key Points to Remember:
-
Mortality refers to death in a population. Australia's youth have among the lowest mortality rates of all life stages, second only to childhood.
-
Always use rates, not raw numbers, when comparing mortality between different population groups. Rates per 100,000 population allow fair comparisons by accounting for different population sizes. This is especially important when comparing Indigenous and non-Indigenous health outcomes.
-
The leading causes of death among youth are injuries and poisoning (including road accidents and drowning), cancers (particularly melanoma, Hodgkin lymphoma, and testicular cancer), diseases of the nervous system (cerebral palsy, epilepsy, muscular dystrophy), and cardiovascular diseases from heart defects.
-
Males experience significantly higher mortality rates than females across nearly all causes, with the gender gap widening during late adolescence. This is largely due to higher rates of risk-taking behaviour among males.
-
Youth mortality rates have decreased dramatically over recent decades (from about 67 per 100,000 in 1990 to about 30 per 100,000 in 2019 for 15-19 year olds), thanks to advances in technology, education, medical treatment, and safety measures.
-
Years of life lost (YLL) provides a different perspective on mortality by measuring years of potential life lost due to premature death. Road traffic accidents are the leading cause of YLL among youth, followed by suicide and cancer. Injury-related deaths account for three of the four leading causes of YLL, highlighting the importance of prevention efforts.