Key Skills (VCE SSCE Health and Human Development): Revision Notes
Key Skills
This section covers two essential skills for VCE Health and Human Development students: analyzing patterns in morbidity and mortality over time, and explaining factors that contribute to variations in health status between different population groups.
These two core skills build upon each other:
- Skill 4.9.1: Analyzing patterns in health data over time
- Skill 4.9.2: Explaining variations between different population groups
Both skills require careful data examination and the ability to connect health patterns to relevant factors.
Analysing patterns in morbidity and mortality in Australia over time
This skill involves carefully examining data to identify and describe patterns in both illness (morbidity) and death (mortality) over time. You'll often be provided with graphs, tables, or charts to help demonstrate this skill, and you may be asked to explain possible reasons for the patterns you observe.
Understanding analysis
Analysis means carefully examining patterns shown in data. When analyzing health data over time, you should:
- Identify overall trends (increasing, decreasing, or stable)
- Note any fluctuations or variations in the pattern
- Use specific data points to support your observations
- Compare different groups where relevant
The DAF Approach to Data Analysis:
When analyzing health data, follow this systematic approach:
- Describe the data - What does the graph/table show?
- Analyse the pattern - What's the overall trend?
- Factor explanation - Why might this pattern exist?
Example: Under-five mortality rates
Let's look at an example examining under-five mortality rates for Indigenous and non-Indigenous children over time.
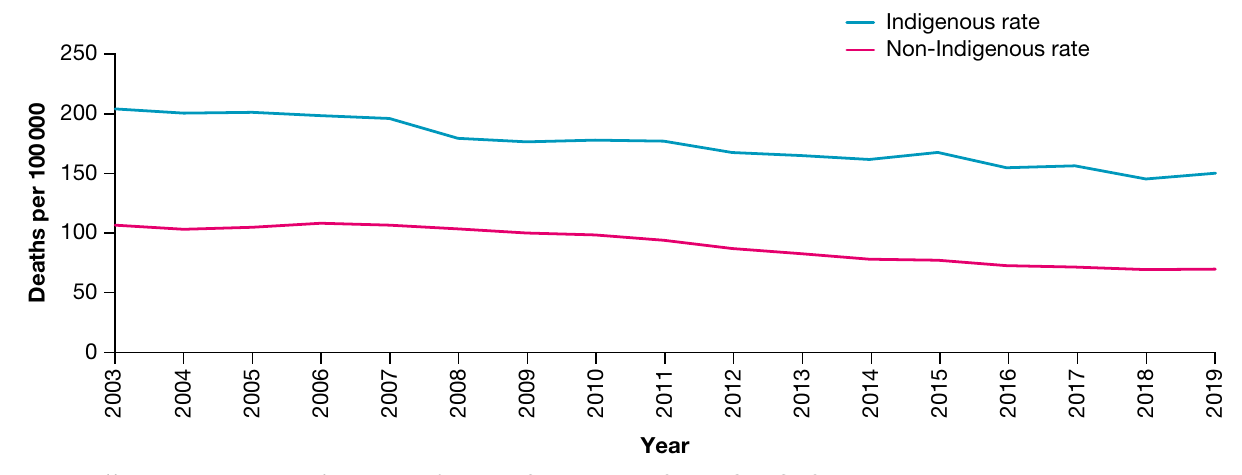
Worked Example: Describing Mortality Rate Patterns
When describing this data, you should identify the pattern for each group using specific values:
Indigenous children: The mortality rate varied across the period but showed an overall decline, decreasing from approximately 205 deaths per 100,000 people in 2003 to around 150 deaths per 100,000 people in 2019.
Non-Indigenous children: The mortality rate stayed relatively steady and decreased gradually from approximately 105 deaths per 100,000 people in 2003 to around 70 deaths per 100,000 people in 2019.
Key observation: Both groups experienced declining mortality rates, but Indigenous children consistently experienced higher rates throughout the entire period.
Explaining patterns
After describing patterns in the data, you may need to explain possible reasons for the trends. It's crucial to read the question carefully to ensure your explanation matches what's being asked.
For example, if asked to explain the overall decrease in under-five mortality rates in Australia, you should focus on factors that have improved over time, such as:
Education: Improved education about maternal nutrition and the importance of maternal healthcare over time has helped babies develop more optimally, which decreases the under-five mortality rate.
Access to healthcare: Improvements in both access to and quality of healthcare mean that health conditions can be prevented more easily, contributing to decreased under-five mortality rates in Australia over time.
Match Your Explanation to the Question
Always ensure your explanation addresses the specific focus of the question. For instance, if the question asks about overall trends in Australia, don't discuss differences between population groups unless specifically asked.
Common mistake: Students often provide general factors without linking them to the specific pattern or timeframe mentioned in the question.
Practice activity: Diabetes prevalence
Let's practice this skill using data on diabetes prevalence.
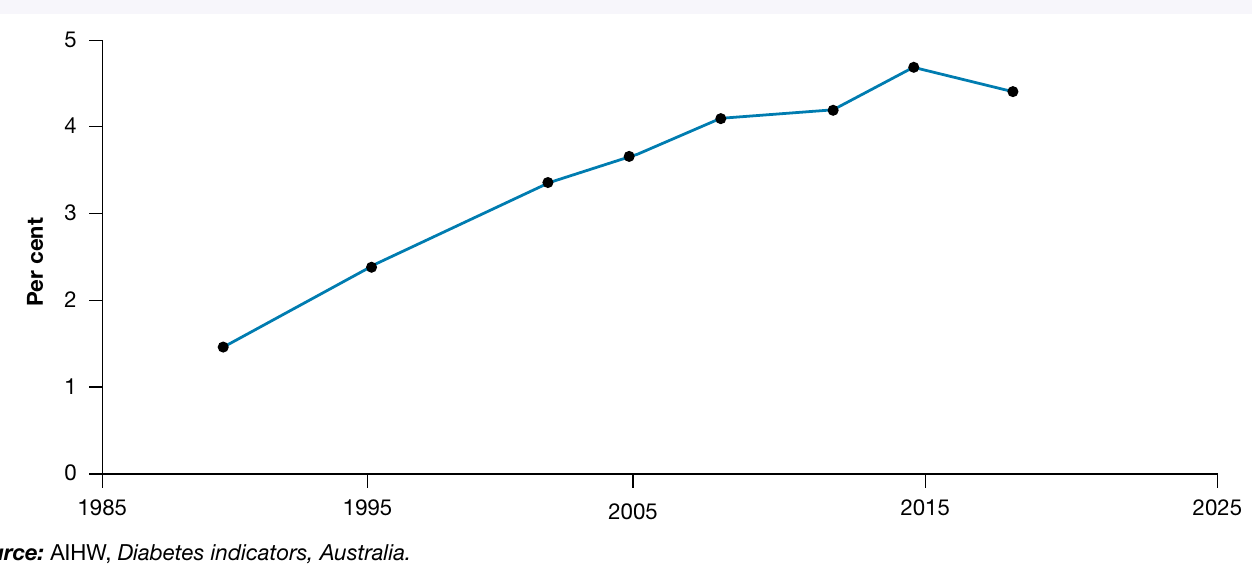
Practice Questions:
- Describe the change in the prevalence of diabetes shown in the graph above.
- Identify two factors and explain how each may have contributed to the overall change in diabetes prevalence between 1990 and 2018.
Tip: When describing changes, include specific values from the start and end of the time period, and mention the overall trend (increase, decrease, or stability).
Analysing health information to explain variations between population groups
This skill involves examining health data to identify differences in health status or risk factors between population groups, then explaining the biological, sociocultural, and environmental factors that contribute to these differences.
Understanding the skill
Analyzing health information requires two key steps:
- Identify differences: Examine data to spot variations in health status or risk factors between groups (such as males and females, Indigenous and non-Indigenous Australians, or different age groups)
- Explain factors: Use your knowledge of biological, sociocultural, and environmental factors to explain why these differences exist
Health information can be presented in various formats including written text, graphs, tables, and charts. Practicing with different data formats will help develop this skill.
The BSE Framework for Factor Analysis
Use this framework to organize your thinking about health variations:
- Biological factors - Body systems, genetics, hormones
- Sociocultural factors - Behaviors, attitudes, cultural practices, access to resources
- Environmental factors - Physical surroundings, housing, infrastructure
Example: Heart attack rates between males and females
Let's examine data showing DALY (Disability-Adjusted Life Years) rates due to heart attacks for males and females across different age groups.
What is DALY?
DALY is a measure that combines years of life lost due to premature death and years lived with disability. It provides an overall measure of disease burden.
- Lower DALY rates indicate better health outcomes
- Higher DALY rates indicate greater disease burden
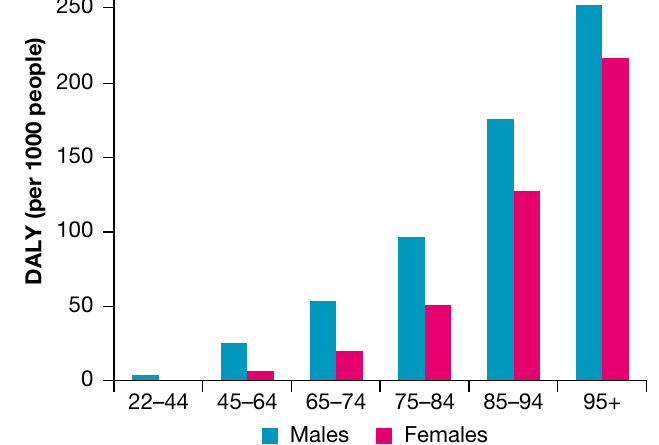
Worked Example: Analyzing Gender Differences in Heart Attack Rates
Step 1: Describe the difference
Males experienced higher DALY rates due to heart attacks than females across all age groups. For example:
- In the 45-64 age group, males had a rate of approximately 25 per 1,000 population compared to approximately 5-10 per 1,000 for females
- In the 75-84 age group, the rate for males was approximately 95 per 1,000 compared to around 50 per 1,000 for females
Step 2: Identify the pattern
The difference between male and female rates increases with age, suggesting that biological and lifestyle factors accumulate over time to create larger health disparities.
Identifying contributing factors
Once you've described the difference in health status, the next step is to brainstorm factors that might explain this difference. Consider biological, sociocultural, and environmental factors.
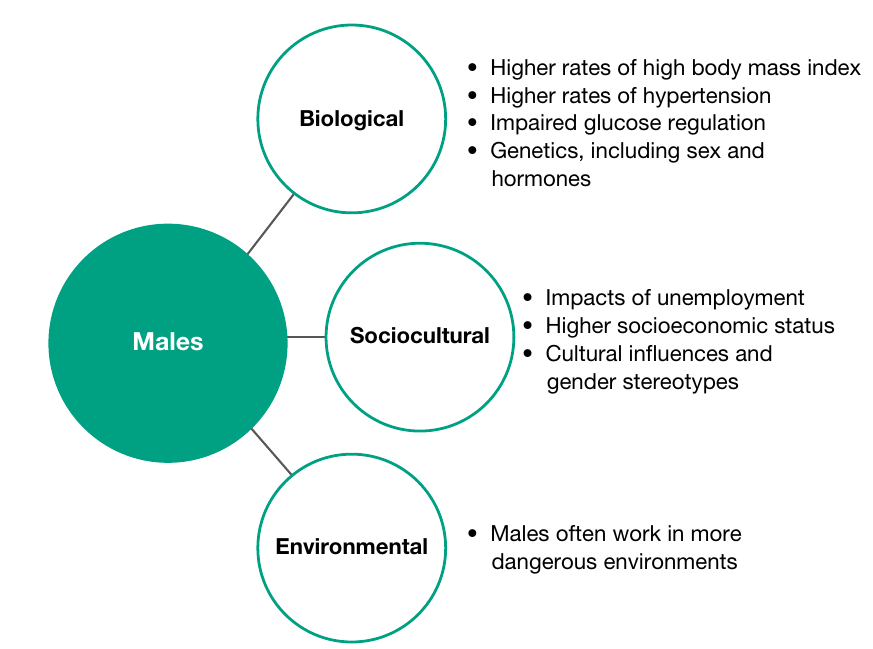
The diagram above shows how multiple factors interact to influence health outcomes. When explaining differences between population groups, you should consider factors from each category and how they specifically relate to the health outcome being examined.
Explaining the differences
When answering questions, always check whether you need to discuss specific types of factors (biological, sociocultural, or environmental) or whether you can choose. If not specified, it's best to include a mix of factor types to demonstrate comprehensive understanding.
Worked Example: Explaining Heart Attack Rate Differences
Biological factor: Males are more likely to store fat around the abdomen compared to females. Fat stored around the abdomen increases the risk of heart attack and may contribute to the difference in heart attack rates experienced between males and females.
Sociocultural factor: Gender stereotypes and peer pressure influence health outcomes for males compared to females. Males are often portrayed as needing to be strong, which contributes to males being less likely to access healthcare. As a result, risk factors for heart attack such as hypertension may remain untreated, increasing the rate of heart attacks for males compared to females.
Note: Each explanation clearly identifies the factor type, describes how it operates, and links it directly to the health outcome (heart attack rates).
Key steps for analysis
- Read the question carefully: Identify exactly what you're being asked to analyze
- Examine the data: Look for patterns, trends, and differences between groups
- Use specific values: Support your observations with data from the graphs or tables
- Brainstorm factors: Think about biological, sociocultural, and environmental factors that might be relevant
- Link factors to outcomes: Explain how each factor contributes to the differences you've identified
- Check your response: Ensure you've answered the specific question asked
Common Mistakes to Avoid:
- Listing factors without explaining how they relate to the health outcome
- Providing vague descriptions like "males have higher rates" without specific data values
- Discussing factors that aren't relevant to the specific health outcome being examined
- Forgetting to identify the factor category (biological, sociocultural, or environmental)
Practice activity: Overweight and obesity rates
Let's practice this skill using data on overweight and obesity rates.
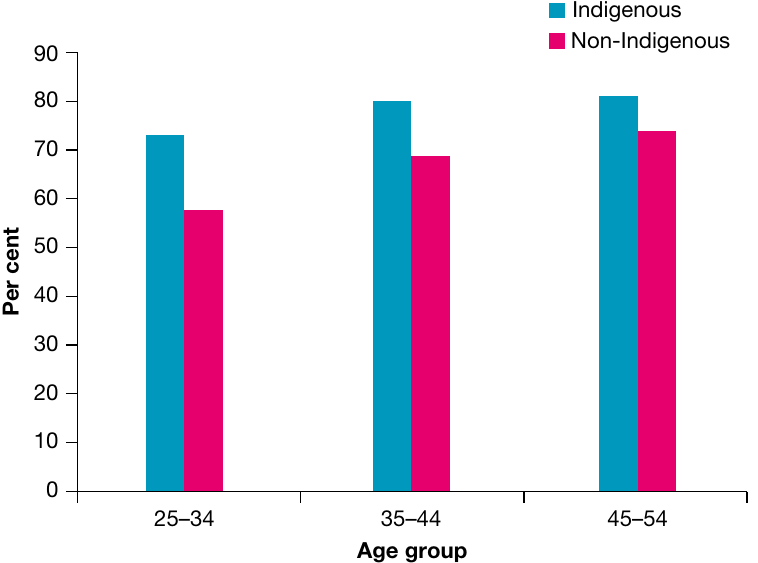
Practice Questions:
- Identify two trends in the overweight/obesity rates shown in the graph above.
- Using two biological, sociocultural, and/or environmental factors, discuss possible reasons for the difference in overweight/obesity rates between Indigenous and non-Indigenous Australians.
Analysis tip: Look at both the differences between groups AND how rates change across age groups. Both patterns are important!
Exam tips
Essential Exam Strategies:
- Use data to support your analysis: Always include specific values from graphs or tables when describing patterns
- Be precise with trends: Use terms like "increased from X to Y" or "decreased gradually" rather than vague descriptions
- Answer the question asked: Focus on what the question specifically asks for (e.g., overall trends vs. differences between groups)
- Structure your explanations: Clearly identify the factor category (biological, sociocultural, or environmental), then explain how it relates to the health outcome
- Practice with different data formats: Work with line graphs, bar charts, tables, and written data to build confidence
- Link factors to outcomes: Don't just list factors - explain how they contribute to the health pattern or difference you've identified
Key Points to Remember:
- Analysis means carefully examining patterns in health data and using specific values to support your observations
- When analyzing patterns over time, describe overall trends and note any fluctuations
- Always read questions carefully to ensure your explanation matches the specific focus
- Use the BSE framework to organize your thinking: Biological, Sociocultural, and Environmental factors
- DALY is an important measure combining years of life lost and years lived with disability
- When explaining differences between groups, clearly identify the factor type and link it to the specific health outcome
- Practice with various data formats to develop confidence in analyzing different types of health information
- Remember the DAF approach: Describe, Analyse, Factor explanation