Graphs of Sine and Cosine (VCE SSCE Mathematical Methods): Revision Notes
Graphs of Sine and Cosine
Introduction
The sine and cosine functions are fundamental periodic functions that repeat their patterns at regular intervals. Understanding their graphs and how to transform them is essential for working with circular functions.
Graph of the sine function
The basic sine function produces a smooth, wave-like curve. Here's what it looks like:
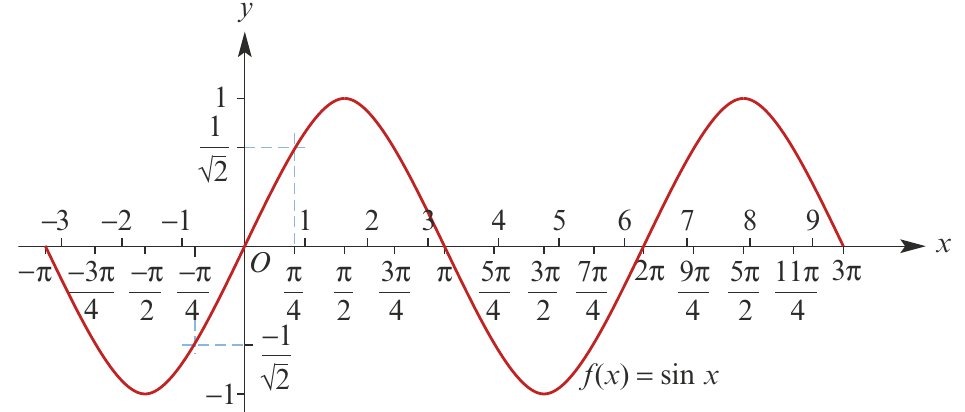
Key properties of
Periodic nature
When a function repeats the same pattern over and over, we call it a periodic function. The distance along the x-axis before the pattern repeats is called the period of the function. Some textbooks also refer to this as the wavelength.
For , the period is units. This means the graph completes one full cycle every units along the x-axis.
Amplitude
The amplitude is the distance between the middle position (the x-axis) and the maximum (or minimum) position of the wave.
For :
- Maximum value =
- Minimum value =
- Amplitude = 1
Graph of the cosine function
The basic cosine function also produces a wave-like curve:
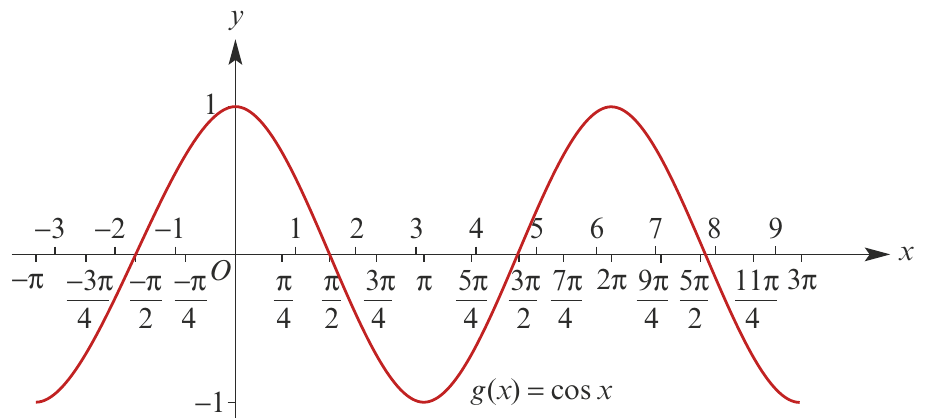
Key properties of
Period and amplitude
Like the sine function:
- Period =
- Amplitude =
Relationship to sine
The graph of is identical to the graph of shifted horizontally. Specifically, if you move the sine graph π/2 units to the left (in the negative x-direction), you get the cosine graph.
Transformations: dilations
We can transform the basic sine and cosine graphs by changing their amplitude and period. This is done using functions of the form:
where and are positive numbers.
Understanding the transformations
Effect of the coefficient
The coefficient controls the amplitude:
- It stretches or compresses the graph vertically
- The new amplitude equals
- Larger values of make taller waves
- The graph oscillates between and
Effect of the coefficient
The coefficient controls the period:
- It compresses or stretches the graph horizontally
- The new period equals
- Larger values of create more cycles in the same space
- The graph completes one full cycle over a distance of
Worked example:
Let's see how these transformations work with a specific example.
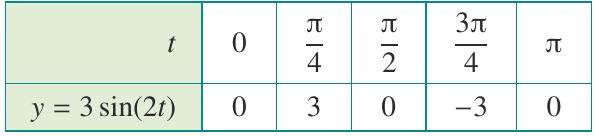
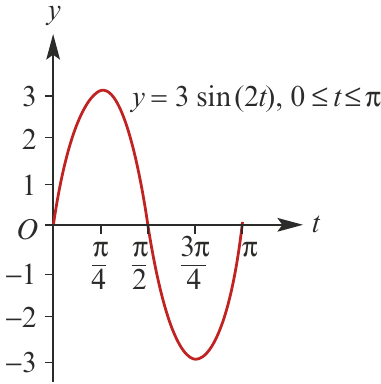
Worked Example: Analyzing the function
For this function:
- Amplitude = 3 (the wave reaches up to and down to )
- Period = π (calculated as , one complete cycle occurs over a distance of )
The graph is obtained from by:
- A vertical dilation (stretch) by a factor of from the t-axis
- A horizontal dilation (compression) by a factor of from the y-axis
Worked example:
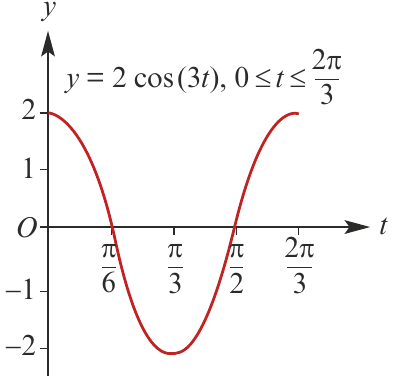
Worked Example: Analyzing the function
For this function:
- Amplitude = 2
- Period = 2π/3 (calculated as )
The graph is obtained from by:
- A vertical dilation by a factor of from the t-axis
- A horizontal dilation by a factor of from the y-axis
Amplitude and period formulas
Here's a summary table of the key formulas:
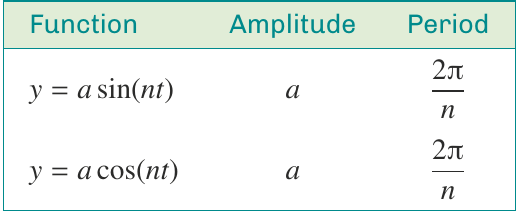
For any function of the form or where and are positive:
Key Formulas:
Amplitude =
Period =
Domain = (all real numbers)
Range =
Worked example: finding amplitude and period
Worked Example: Finding amplitude and period
Question: For each of the following functions with domain , state the amplitude and period:
a)
Amplitude = 2
Period = 2π/3 (calculated as )
b)
Amplitude = 1/2 (take the absolute value of the coefficient)
Period = 4π (calculated as )
c)
Amplitude = 4
Period = 2/3 (calculated as )
Sketching transformed graphs
When sketching graphs of transformed sine and cosine functions, follow these steps:
- Identify the amplitude (how high and low the wave goes)
- Calculate the period (how long one complete cycle is)
- Mark key points on the horizontal axis
- Sketch one complete cycle
- Label the function and axes
Worked example: sketching sine and cosine graphs
Worked Example: Sketching graphs
Question: Sketch the graph of each of the following functions, showing one complete cycle:
a)
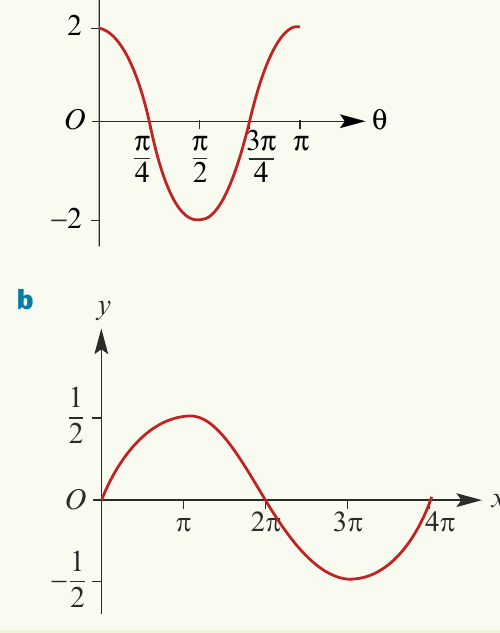
The amplitude is 2.
The period is π (calculated as ).
The graph starts at its maximum value of 2 when , decreases to at , and returns to at .
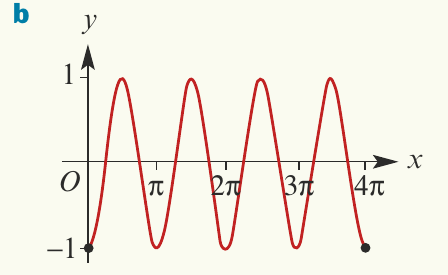
b)
The amplitude is 1/2.
The period is 4π (calculated as ).
The graph starts at when , reaches its maximum of 1/2 at , returns to at , reaches its minimum of at , and completes the cycle at .
Transformations: reflections
When the coefficient is negative, the graph is reflected in the x-axis.
Properties of negative coefficients
For or :
- The amplitude is still (take the absolute value)
- The period is still
- The graph is flipped upside down compared to the positive version
Worked example: graphs with reflections
Worked Example: Graphing with reflections
Question: Sketch the following graphs for :
a)
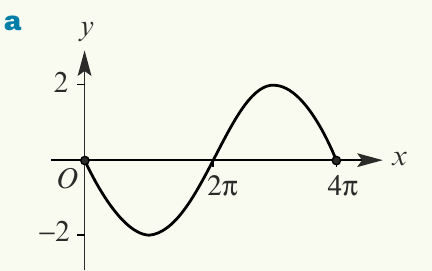
The graph is obtained from by reflecting in the x-axis.
Amplitude = 2
Period = 4π
b)
The graph is obtained from by reflecting in the x-axis.
Amplitude = 1
Period = π
Important note about odd and even functions
Recall that:
- Sine is an odd function:
- Cosine is an even function:
This means:
- When you reflect in the y-axis, you get
- When you reflect in the y-axis, the graph stays the same
Summary of properties
For positive numbers and , the functions , , , and all share these properties:
Key Properties to Remember:
Period =
Amplitude =
Domain = (all real numbers)
Range =
Remember!
Essential Takeaways:
- Sine and cosine are periodic functions that repeat every units in their basic form
- The amplitude tells you how high and low the wave goes from the centre line
- The period tells you how long it takes for one complete cycle
- For or : amplitude = a and period = 2π/n
- A negative coefficient reflects the graph in the x-axis but doesn't change the amplitude or period
- The cosine graph is just the sine graph shifted π/2 units to the left