Sketching Graphs (VCE SSCE Mathematical Methods): Revision Notes
Sketching Graphs
Understanding phase shifts
When we work with trigonometric functions, we often need to sketch graphs that have been shifted horizontally. These horizontal shifts are called phase shifts.
The general forms we work with are:
The term (epsilon) is called the phase and determines how far the graph shifts along the horizontal axis.
How phase shifts work
Key principle: The phase shift moves the entire graph horizontally.
- For : the graph shifts right by units
- For : the graph shifts left by units
This might seem backwards at first! Remember that the sign inside the brackets is opposite to the direction of the shift.
Worked example: sketching with phase shifts
Worked Example: Sketching Trigonometric Functions with Phase Shifts
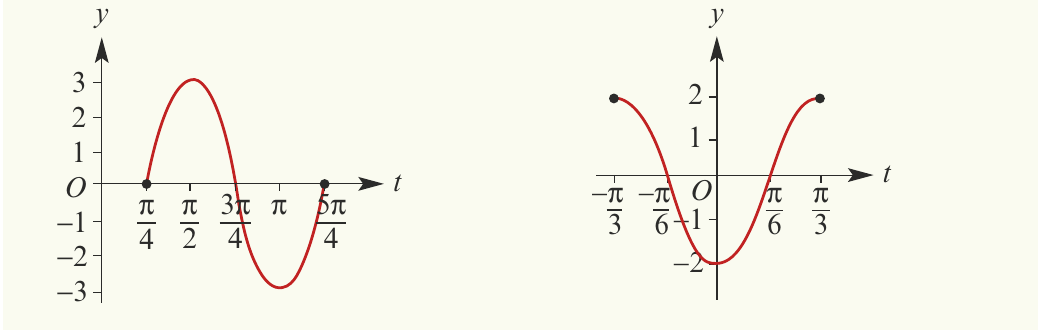
Part a: Sketch for
First, identify the key features:
- Range: (the amplitude is 3)
- Period:
- Phase shift: The graph of is shifted units to the right
Part b: Sketch for
Key features:
- Range: (the amplitude is 2)
- Period:
- Phase shift: The graph of is shifted units to the left
Finding endpoints and key points
When sketching over a specific interval, it's important to calculate the exact y-values at the endpoints. This ensures your graph is accurate at the boundaries and helps you understand the behavior of the function over the given domain.
Worked Example: Finding Endpoints and Sketching
For the function , :
Finding the endpoints:
Sketching the graph:
The graph of is the graph of shifted units to the right.
Key features:
- Period:
- Amplitude:
- Endpoints: and
Helpful approach:
-
Start at (where the shifted sine curve would normally start at zero)
-
Each complete cycle has length for a half-loop
-
Mark key points at intervals of from the starting position
Vertical translations
In addition to horizontal shifts, we can also translate graphs vertically. This gives us the general forms:
The term translates the graph vertically:
- shifts the graph up by units
- shifts the graph down by units
Effect on range
When we add a vertical shift :
- The new range becomes
- The central axis of the wave moves from to
This means the entire graph shifts vertically, including both the maximum and minimum values.
Worked example: combined transformations
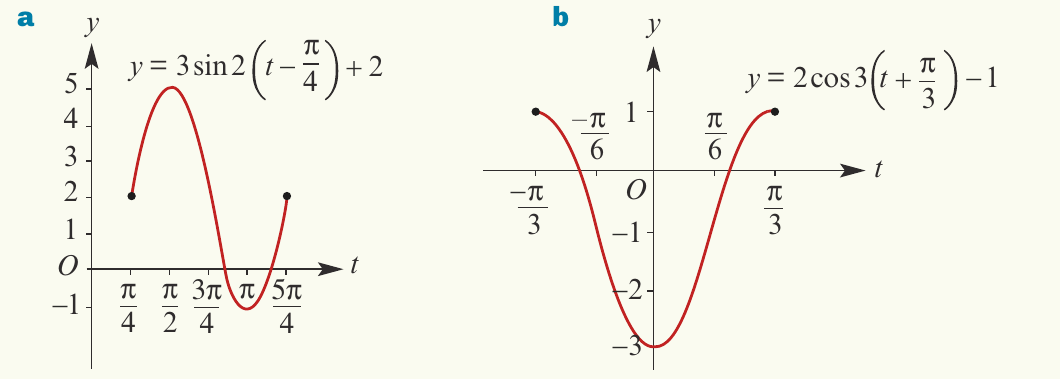
Worked Example: Combining Horizontal and Vertical Shifts
Part a: Sketch for
The graph of is:
- Shifted units to the right
- Shifted units up
The range is now
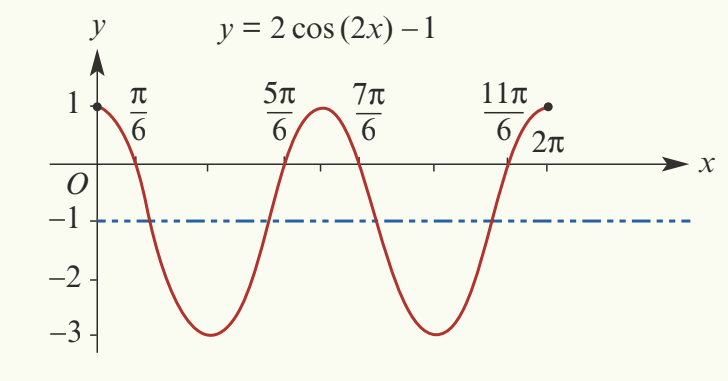
Part b: Sketch for
The graph of is:
- Shifted units to the left
- Shifted unit down
The range is now
Finding axis intercepts
When sketching trigonometric graphs, finding where they cross the x-axis (the x-intercepts) helps us draw them accurately. These intercepts represent the points where the function equals zero, which are often key features in understanding the graph's behavior.
Method: Set and solve the equation for .
This gives you the exact x-coordinates where the graph crosses the horizontal axis.
Worked Example: Determining x-Intercepts
Part a: Sketch for and find the x-intercepts.
To find x-intercepts, solve :
The x-axis intercepts are at and .
Part b: Sketch for and find the x-intercepts.
To find x-intercepts, solve :
The x-axis intercepts are at , , , and .
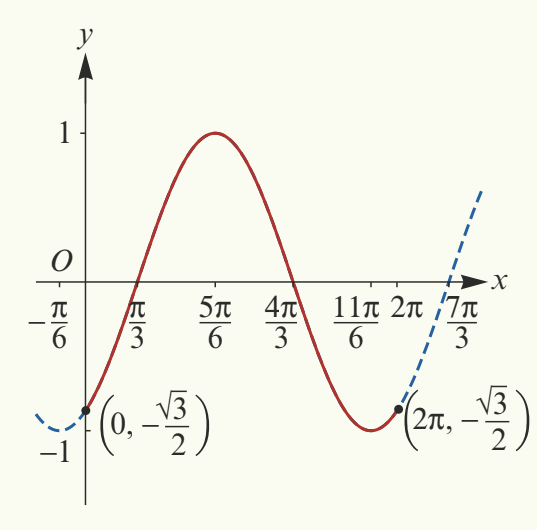
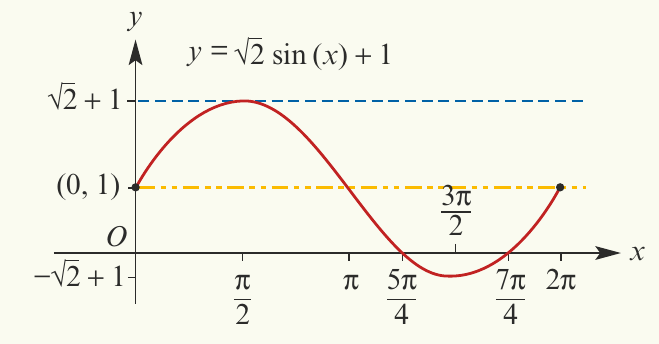
Part c: Sketch for and find the x-intercepts.
Set the equation equal to zero and solve:
The x-axis intercepts are at , , , and .
Key formulas and terminology
Amplitude: The value determines how far the graph extends above and below its central axis.
Period: For functions of the form or , the period is .
Phase shift: The value in :
- : shift right by units
- : shift left by units
Vertical shift: The value in shifts the graph up or down by units.
Range:
- For : the range is
- For : the range is
Key Points to Remember:
- Phase shifts move the graph horizontally: shifts right, shifts left
- Vertical shifts move the graph up or down by the value of
- To find x-intercepts, set and solve the resulting equation
- The period of or is
- Always calculate endpoint values when sketching over a specific interval to ensure accuracy