Measures of Spread (VCE SSCE Mathematical Methods): Revision Notes
Measures of Spread
Introduction
When describing a probability distribution, understanding how spread out the data is matters just as much as knowing the center. Two distributions can have identical centers but very different spreads, as shown in the diagram below.
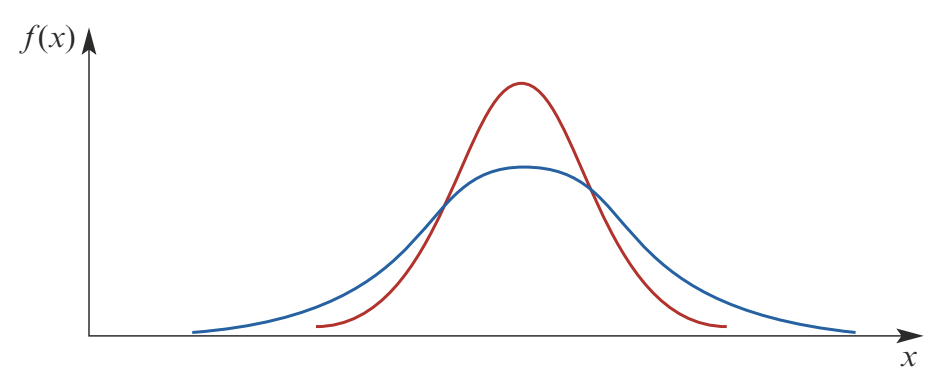
The diagram shows two distributions with the same shape and center, but different amounts of spread. The red curve shows less spread (values cluster tightly around the mean), while the blue curve shows greater spread (values are more dispersed).
Several measures can be used to quantify spread, including variance, standard deviation, range, and interquartile range. The most commonly used are variance and standard deviation.
Variance and Standard Deviation
What is Variance?
Variance is a measure that quantifies how far values typically fall from the mean of a distribution. For a continuous random variable with mean , variance is defined as the expected value of the squared distance from to :
Variance is typically denoted by , where is the Greek letter sigma.
Understanding Units
Think of variance as the expected value of how far (squared) observations are from the mean. Because we square the distances, variance is not in the same units as the original random variable .
Units Matter! If measures length in metres, then variance would be in square metres. This is why we need standard deviation to get back to the original units.
To get a measure of spread in the appropriate units, we take the square root of the variance.
What is Standard Deviation?
Standard deviation is defined as:
Standard deviation is usually denoted by . It provides a measure of spread in the same units as the original random variable.
Computational Formula for Variance
While the definitional formula is useful for understanding variance, a more convenient formula for calculations is:
This computational formula is generally easier to work with when finding variance.
Why use the computational formula? The formula is much simpler to calculate with than the definitional formula, especially when working with integrals. Think of it as "E of X-squared minus mean-squared" (VEMM).
Proof of Computational Formula
We can derive the computational formula from the definitional formula through algebraic manipulation:
Expanding the squared term:
Splitting into separate integrals:
Since and :
Worked Example: Finding Variance and Standard Deviation
Find the variance and standard deviation of the random variable which has the probability density function with rule:
Solution
We'll use the computational formula .
Step 1: Find
Step 2: Use the known mean
From a previous calculation, we know that .
Step 3: Calculate the variance
Step 4: Find the standard deviation
Interquartile Range
What is the Interquartile Range?
The interquartile range (IQR) captures the spread of the middle 50% of the distribution. It is calculated as the difference between the 75th percentile (also called or the third quartile) and the 25th percentile (also called or the first quartile):
The IQR is particularly useful because it focuses on the central half of the distribution and is not affected by extreme values in the tails.
Worked Example: Determining the Interquartile Range
Determine the interquartile range of the random variable which has the probability density function:
Solution
Step 1: Find the 25th percentile
To find , we solve:
(Note: We take the positive solution since )
Step 2: Find the 75th percentile
To find , we solve:
Step 3: Calculate the IQR
Exam Tip: When solving for percentiles, always check that your solutions fall within the valid range of the probability density function. In this case, negative solutions were not appropriate because the function is only defined for .
Remember!
Key Points to Remember:
-
Variance () measures the spread of a distribution about its mean and is calculated as
-
Standard deviation () is the square root of variance and gives a measure of spread in the same units as the original variable
-
Use the computational formula rather than the definitional formula for easier calculations
-
The interquartile range (IQR) is the difference between and , representing the spread of the middle 50% of the distribution
-
To find percentiles, solve where is the desired percentile expressed as a decimal (e.g., 0.25 for the 25th percentile)