Standardisation and the 68–95–99.7% Rule (VCE SSCE Mathematical Methods): Revision Notes
Standardisation and the 68–95–99.7% Rule
Understanding the 68–95–99.7% rule
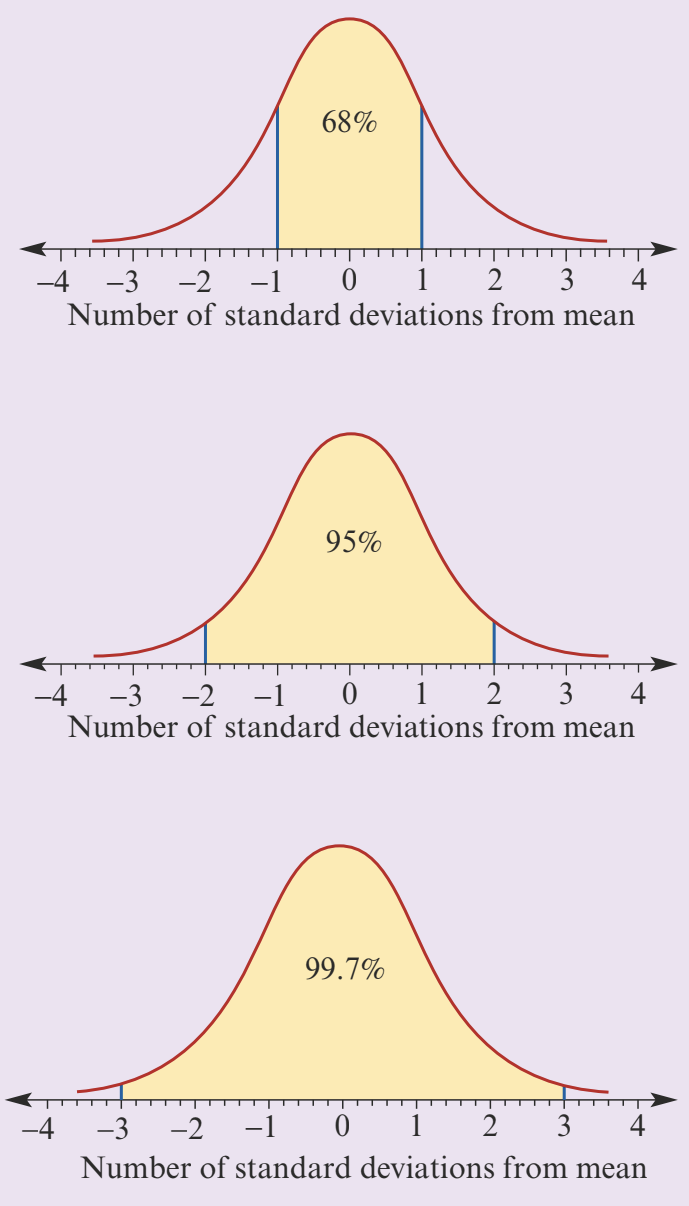
When data follows a normal distribution, we can make powerful predictions about where most values will fall. The 68–95–99.7% rule (also called the empirical rule) tells us exactly how data spreads around the mean.
For any normally distributed random variable, approximately:
- 68% of values lie within one standard deviation of the mean
- 95% of values lie within two standard deviations of the mean
- 99.7% of values lie within three standard deviations of the mean
This rule is incredibly useful because if we know the mean () and standard deviation () of a normally distributed variable, we can quickly make important statements about how the data values are distributed.
Worked example: IQ scores and standard deviations
Worked Example: IQ Scores and Standard Deviations
Question: IQ test scores are normally distributed with mean and standard deviation . What percentage of the distribution lies within one, two, or three standard deviations of the mean?
Solution:
Since the scores are normally distributed with and , we can apply the 68–95–99.7% rule.
Approximately:
-
68% of scores lie between 85 and 115 (one standard deviation either side: )
-
95% of scores lie between 70 and 130 (two standard deviations either side: )
-
99.7% of scores lie between 55 and 145 (three standard deviations either side: )
Calculating tail probabilities
We can also determine what percentage of values fall in the tails of the distribution (the extreme ends). This uses the symmetry of the normal curve and the fact that the total area under the curve equals 100%.
Worked Example: Finding Extreme Values
Question: From the IQ example above, we know 95% of scores lie between 70 and 130 (within two standard deviations of the mean). What percentage of scores are more than two standard deviations from the mean (less than 70 or greater than 130)?
Solution:
If 95% of scores lie within two standard deviations, then the remaining 5% must lie outside this region.
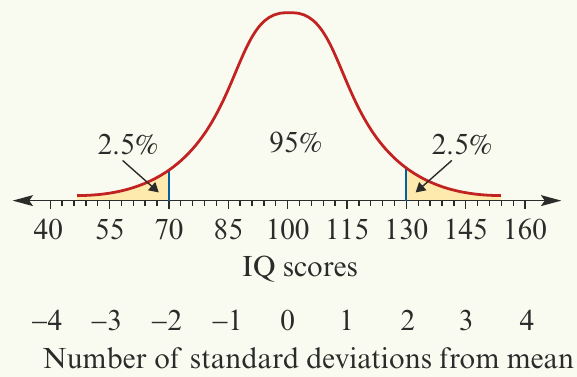
Using the symmetry of the normal distribution:
-
2.5% of scores are below 70
-
2.5% of scores are above 130
This means if you scored above 130 on this IQ test, you would be in the top 2.5% of all test-takers.
Standardised values (z-values)
Why standardise?
The standard deviation is a natural measuring stick for normally distributed data. For example:
-
An IQ score of 112 (with and ) is less than one standard deviation from the mean - this is a typical score within the middle 68%
-
An IQ score of 133 is more than two standard deviations above the mean - this is exceptional, placing someone in the top 2.5%
What are z-values?
To gain deeper insight into data, we convert normally distributed values into standardised values or z-values. These show the number of standard deviations each data value lies from the mean.
The standardisation formula
To standardise a data value :
Or symbolically:
Where:
- is the standardised value (z-value)
- is the original data value
- is the mean of the distribution
- is the standard deviation of the distribution
Understanding positive and negative z-values
Standardised values can be positive or negative:
-
A positive z-value indicates the data value lies above the mean
-
A negative z-value indicates the data value lies below the mean
Worked Example: Calculating a Z-Value
An IQ score of 90 lies below the mean. Its standardised value is:
This tells us the score is approximately 0.67 standard deviations below the mean.
The standard normal distribution
There are infinitely many different normal curves depending on the values of and . However, when we convert to z-values (measuring in standard deviations from the mean), all normal curves transform into the same curve called the standard normal distribution.
The standard normal distribution has:
- Mean
- Standard deviation
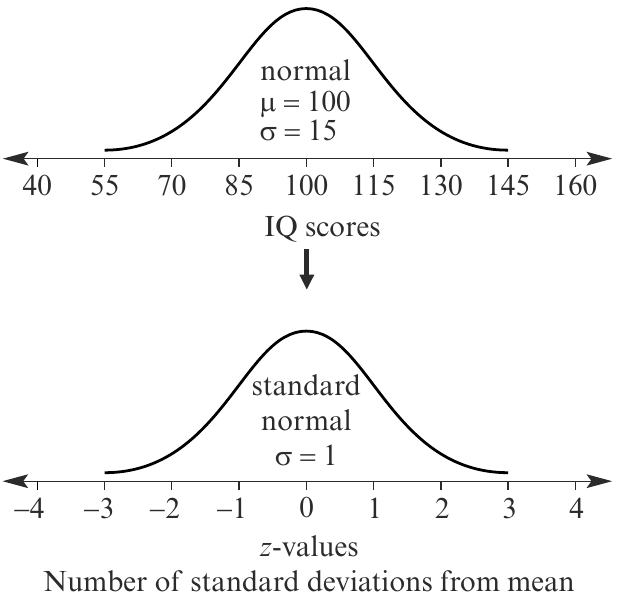
This transformation is powerful because it allows us to compare values from different normal distributions on the same scale.
Key Points to Remember:
-
The 68–95–99.7% rule states that approximately 68% of values lie within 1 standard deviation, 95% within 2 standard deviations, and 99.7% within 3 standard deviations of the mean
-
Use symmetry to find tail probabilities: if 95% lies within 2 standard deviations, then 5% lies outside (2.5% in each tail)
-
Standardised values (z-values) measure how many standard deviations a data point is from the mean using the formula
-
A positive z-value means above the mean; a negative z-value means below the mean
-
All normal distributions can be transformed into the standard normal distribution (, ) through standardisation