Changing Places (AQA A-Level Geography): Revision Notes
Place Studies
Introduction to place studies
The final part of the Changing Places topic requires you to conduct an in-depth investigation of two contrasting places. One should be local to you, whilst the other should be contrasting and more distant. This approach allows you to explore how places differ and change over time.
Selecting appropriate places for study
When choosing your places for study, several key factors should guide your decision:
Size and walkability
Your chosen place should be small enough to explore thoroughly on foot within a few hours. This manageable scale allows for detailed fieldwork and observation.
Location considerations
- Your local place could be where you live, attend school, or an area within your community
- The location may be urban or rural in character
- The contrasting place must show significant differences in terms of economic development, population density, cultural background, or political and economic systems
- While the geographical distance between the two places may be relatively small, the contrast in character must be clear
Integration with wider learning
Your place studies should build upon and apply knowledge from other parts of the specification. This integrated approach helps you understand how continuity and change affect life in different places.
Data availability
Before committing to specific locations, check that sufficient data and varied information sources are available. For international locations, charities, non-governmental organisations, government websites and global institutions like the World Bank can provide valuable information.
The danger of single stories
As writer Chimamanda Adichie warned in her TED Talk, "The single story creates stereotypes and the problem with stereotypes is not that they are untrue but they're incomplete, they make one story become the only story... It is impossible to engage properly with a place or person without engaging with all of the stories of that place or person."
This warning emphasises the need to use multiple sources and perspectives when studying places to avoid creating incomplete or biased accounts.
Context for the example place studies
This revision note uses two contrasting places as examples to demonstrate the approaches and resources available for place studies:
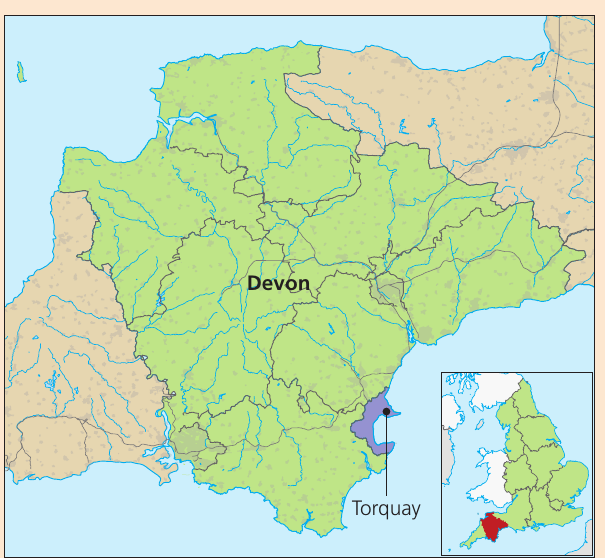
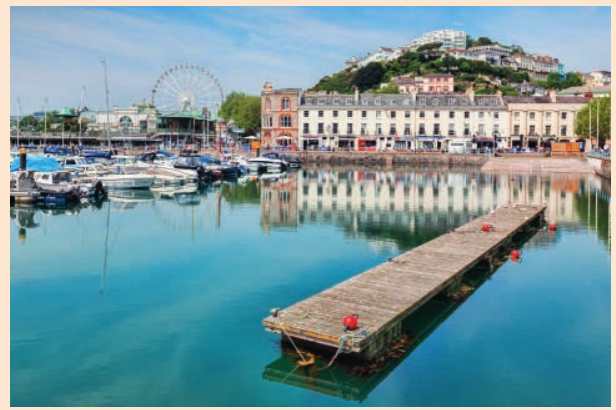
Local place: Torquay, Devon
Torquay serves as the local study example. It is a seaside town in South Devon that has experienced significant change in recent decades. The town saw a decline in tourist numbers from the 1970s onwards, resulting in subsequent social and economic challenges and a less favourable place identity.
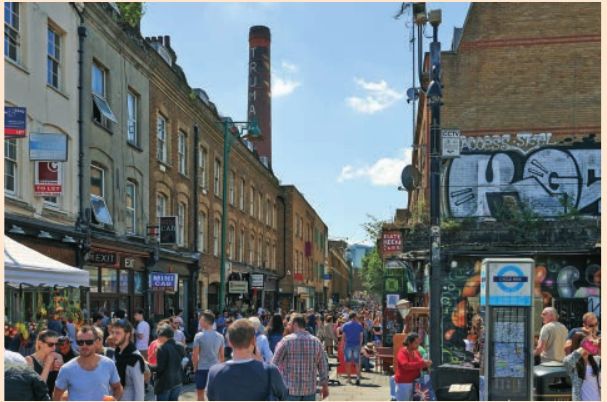
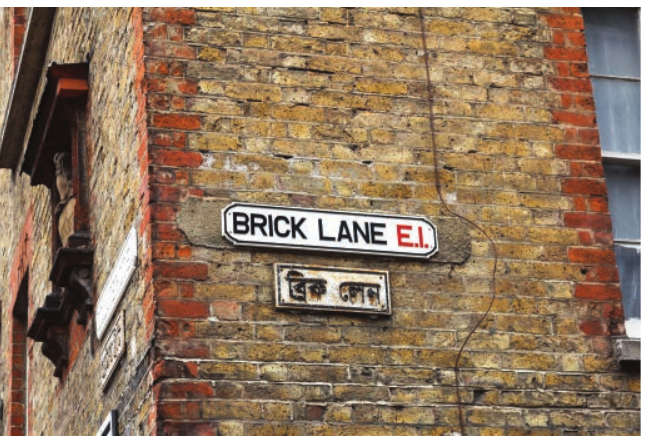
Contrasting place: Brick Lane and Spitalfields, East London
Brick Lane and Spitalfields in the London Borough of Tower Hamlets provides the contrasting study. Unlike Torquay, this area has undergone social and economic changes driven by gentrification and redevelopment projects. The large Bangladeshi diaspora community gives the area distinct cultural characteristics.
Both locations have experienced considerable change over recent decades, making them excellent examples for understanding how places evolve over time.
1. Investigating location and locale
Using maps effectively
Maps provide essential tools for investigating any place. They reveal location, physical geography, human features and patterns of land use.
Ordnance Survey maps (1:25,000 scale)
These detailed maps are particularly useful for rural places. They show:
- Physical geography including relief, land height, aspect and drainage patterns
- Evidence of human impact on the landscape
- Main land uses within the area
By comparing current OS maps with older versions, you can identify changes in the size of settlements, types of land use and infrastructure development.
Street maps
These are better suited to urban areas and come in several forms:
- Goad maps: Highly detailed street maps showing individual buildings and their uses, which can be updated or annotated during fieldwork
- Google Maps and Google Earth: Digital mapping tools providing street-level coverage and geographical detail, plus aerial and satellite imagery
A useful exercise involves comparing your local place on the OS map with its appearance on Google Earth. Consider which characteristics are shown and which are not, and how these digital representations compare with your personal knowledge of the place.
For distant places, Google Street View offers a valuable tool for experiencing what a place looks like. The horizontal and vertical street-level images allow you to see land use and building types that might not otherwise be accessible.
Historical mapping
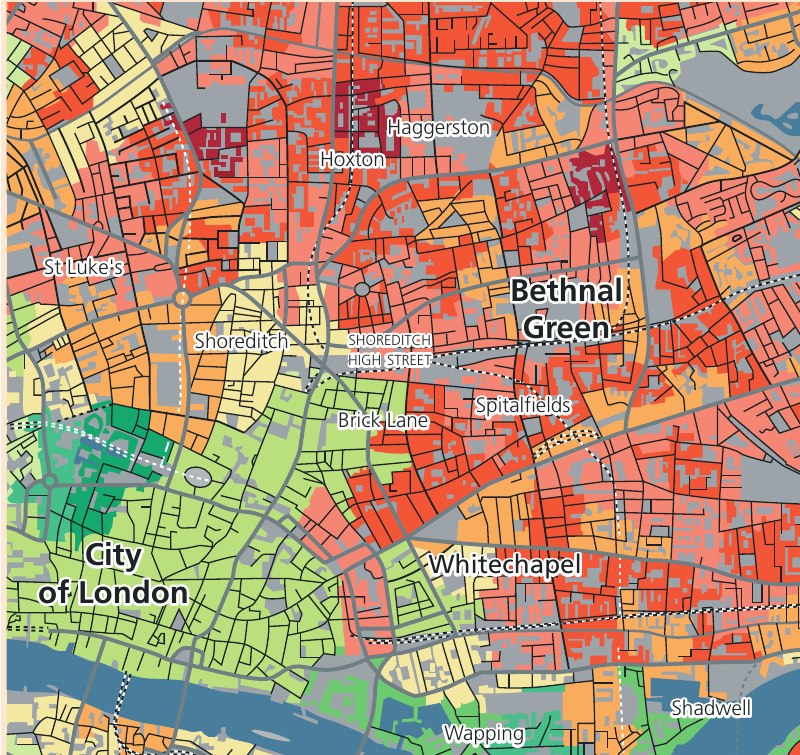
Maps can highlight economic and demographic changes in areas over long periods. Charles Booth's poverty map from around 1890 provides an important example. Over several years, Booth and his researchers visited homes throughout London, interviewing residents and characterising them into seven categories ranging from 'Well-to-do' to 'Vicious, semi-criminal'. The resulting colour-coded map reveals the characteristics of large parts of London at the turn of the twentieth century.
Historical Mapping Example: Brick Lane
For Brick Lane, Booth's poverty maps indicate that the area had mixed economic fortunes at that time. Some parts were classified as poor or very poor, whilst other nearby areas in Whitechapel and the East End experienced more widespread poverty. This historical data provides a baseline for understanding how the area has changed over more than a century.
Literary sources
Books, atlases and newspapers can be used alongside maps to provide historical context about places. Your local library serves as a useful information source, and there may be a Local History Society in your area. These resources help you investigate how places have changed over time and understand the role of past connections on current characteristics.
Internet resources
The internet provides extensive information about different places. Official government websites offer geographical information such as census data and local health statistics.
Remember that internet information is created for various purposes including informing, persuading, selling, presenting viewpoints or creating and changing attitudes. Unlike traditional media such as books and magazines, online content does not require approval before publication, so critical evaluation is essential.
2. Demographic characteristics
Census data provides a key source of geographical information about population characteristics. In the UK, the census is conducted every ten years. Additional socio-economic data on employment, crime and health is generated more regularly.
Key data sources:
- The Office for National Statistics (www.nomisweb.co.uk) - the UK's largest independent producer of official statistics
- The Local Government Association publishes up-to-date data about geographical areas
- LG Inform Plus (http://about.esd.org.uk/) generates reports at census ward level
- www.streetcheck.co.uk enables checking of variables for people living in particular postcodes
- For 2011 census geospatial data: http://maps.cdrc.ac.uk/
Demographic profile: Torquay
Age structure
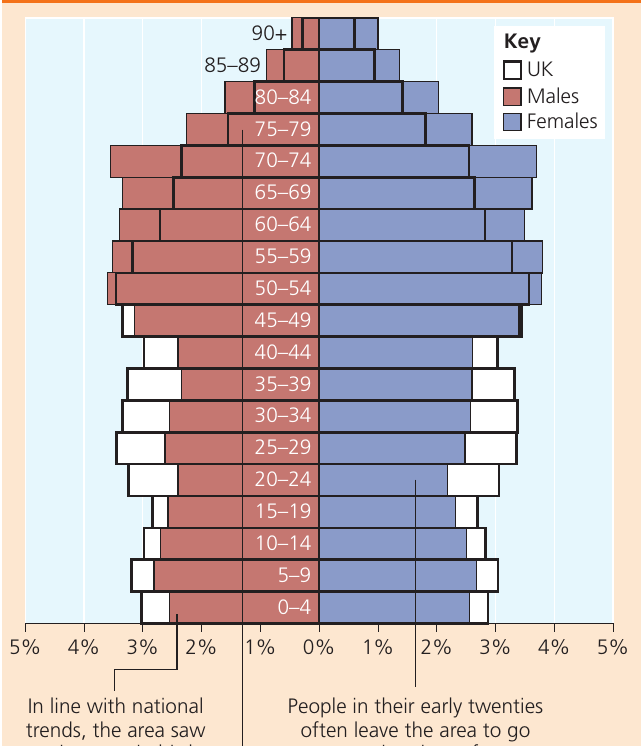
By 2017, Torquay was home to approximately 67,300 people. The population shows a notably higher proportion aged 65 and over compared to national trends. Almost a quarter of residents are in this older age group - significantly higher than the national figure of 18 per cent. This makes Torbay a popular retirement location, which helps explain this demographic pattern.
The population pyramid reveals that people in their early twenties often leave the area, likely to attend university or seek employment opportunities elsewhere. Otherwise, the age structure largely follows national trends.
Ethnic diversity
Torquay has very limited ethnic diversity. In the 2011 census, only 3 per cent of the population identified as not White British. However, the town does have a larger BAME community than the surrounding area, and ethnic diversity has increased over time.
Historically, the tourist-based economy attracted few migrants to Torbay. In the early twenty-first century, there was some in-migration from eastern Europeans, but by 2017 there was only an estimated net gain of 200 migrants from overseas. The area maintains limited ethnic diversity.
Demographic profile: Brick Lane and Spitalfields
Age structure
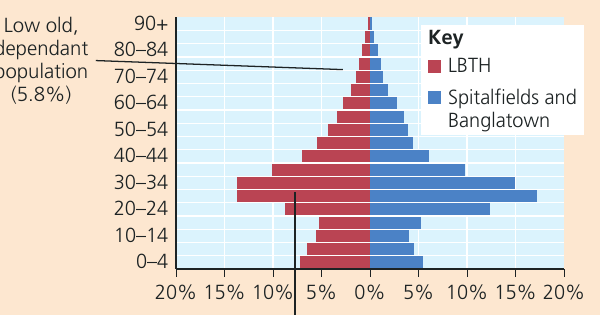
The population of Spitalfields and Banglatown shows a notably high proportion in the economically active 20-40 year age bracket, particularly between ages 25 and 35. Access to employment opportunities in London attracts economically active people, including immigrants. The area is perceived as a trendy cultural hub.
Significantly, there is a low elderly dependent population of just 5.8 per cent - much lower than the borough average.
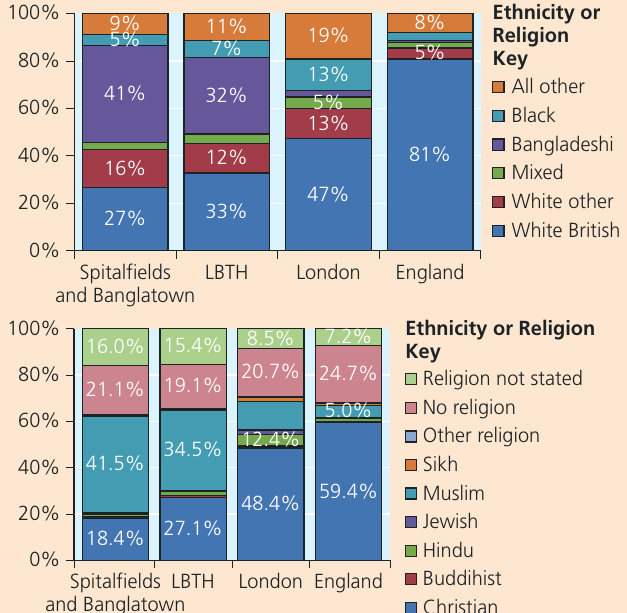
Ethnic and religious diversity
In 2011, residents of Bangladeshi origin accounted for 41 per cent of the population in Spitalfields and Banglatown - substantially higher than the borough average. The proportion of White British residents is considerably lower than the England average. Muslims make up the highest proportion of the population at 41.5 per cent.
This area has a rich ethnic and religious mix resulting from successive waves of migration since the nineteenth century. Different migrant groups have established communities here over time, creating the diverse character seen today.
3. Economic characteristics
To build an economic profile of your places, research the following aspects:
- Employment and unemployment levels
- The balance between primary, secondary and tertiary economic sectors
- Gross Disposable Household Income (GDHI) estimates
- House prices (available from property websites and the Land Registry)
- Access to services for different economic groups
The Index of Multiple Deprivation
The Index of Multiple Deprivation (IMD) is a UK government measure of deprivation at small-area level across England. It combines 37 separate indicators across seven dimensions to provide a comprehensive picture of relative deprivation.
The seven dimensions of deprivation measured are:
- Income
- Employment
- Health deprivation and disability
- Education, skills and training
- Crime
- Barriers to housing and services
- Living environment
The IMD statistics measure relative deprivation, not absolute affluence. Not every person in a highly deprived area will themselves be deprived. Similarly, some deprived people live in the least deprived areas. The 2019 IMD data has been mapped and is available at http://maps.cdrc.ac.uk/.
Economic profile: Torquay
Deprivation patterns
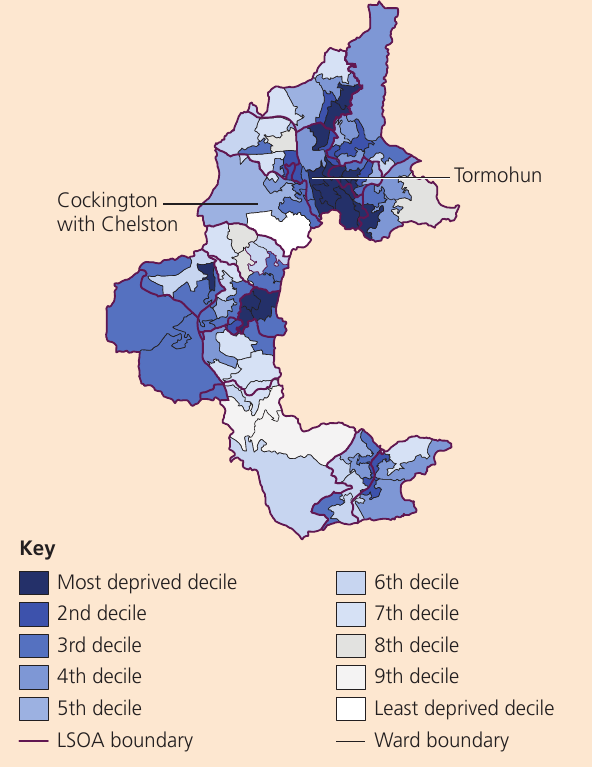
In 2019, Torbay was within the top 20 per cent most deprived local authority areas in England for both average score and local concentration. Several areas within Torquay fell into the top 10 per cent most deprived areas nationally. The figure above shows how GIS and geospatial data effectively identify variation in deprivation across the area.
Although IMD data reveals significant areas of deprivation in Torquay, the town also contains areas of great affluence, like most urban locations.
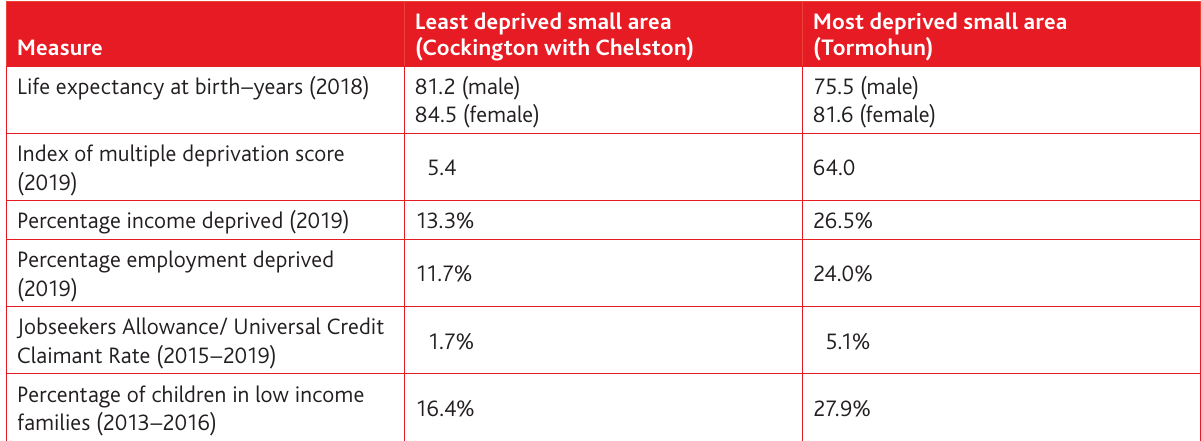
The data comparison between Cockington with Chelston (least deprived) and Tormohun (most deprived) highlights significant income inequality in Torquay. This emphasises the need to examine variation within areas as well as between different places.
Recent economic changes
Strategies such as the redevelopment of Torquay harbour and the designation of Torbay as an urban GeoPark have achieved some success in reviving the town's fortunes in recent years. Future research could examine the social and economic changes brought about by initiatives like these, as well as the impact of the new South Devon link road which has improved accessibility to Torbay.
Economic profile: Brick Lane and Spitalfields
Deprivation changes
Like all inner urban areas, Tower Hamlets contains some areas of significant deprivation, but this has improved in recent years. In 2010, many areas were in the most deprived 10 per cent in England, but by 2019 the majority of the most deprived areas were outside London. Only 2 of the 20 wards in Tower Hamlets are now in the 50 least deprived wards in London.
Gentrification
Gentrification has driven much of this positive trend. Middle-class families have moved into traditionally poorer parts of London, whilst the very poor have relocated to boroughs on the outskirts where housing costs and rents are lower.
Deprivation Change Example: Spitalfields and Banglatown
The Spitalfields and Banglatown area has experienced a significant reduction in deprivation levels. In 2010, it was ranked as the most deprived Lower Super Output Area (LSOA) in all of London, but by 2019 it was ranked 95 out of 633 LSOAs in the capital.
This dramatic improvement demonstrates how geospatial data reveals considerable variation even within small areas, and how rapidly gentrification can transform neighbourhoods.
4. Social characteristics and inequalities
The social dimensions of the Index of Multiple Deprivation can be examined in greater detail through additional data sources:
- Local educational data and school performance (www.education.gov.uk/schools/performance/)
- Crime data (www.police.uk)
- Health-related data and health profiles (https://fingertips.phe.org.uk/profile/health-profile)
The health profile website provides excellent resources detailing wider determinants of health, including social and economic indicators. Data is available at various geographical scales, and the website enables mapping and comparison between different areas.
Health profiles published annually give a snapshot of health for each local authority in England.
Health inequalities in Torquay
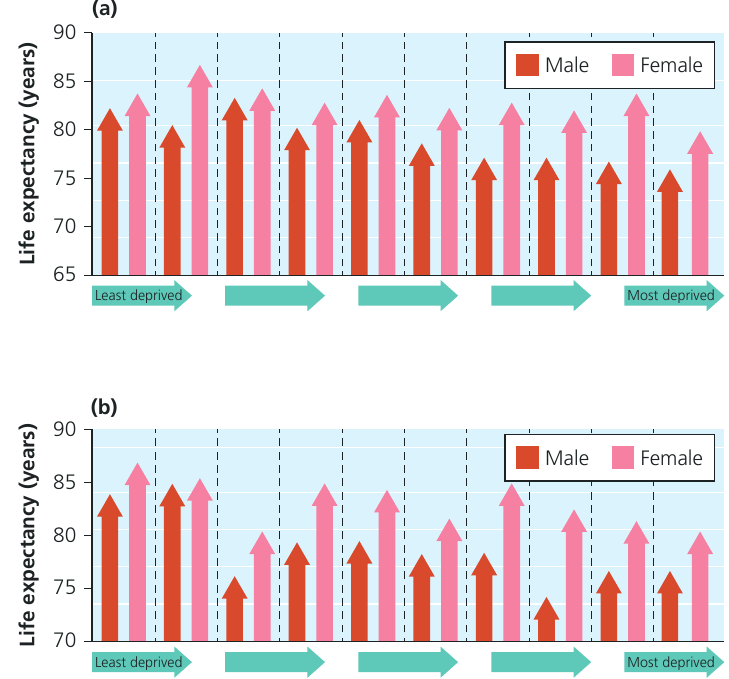
Within both Torbay and Tower Hamlets, life expectancy at birth is not evenly distributed across populations. In Torbay, the gap between the most and least deprived communities can be as much as 11 years, with averages ranging between 7.2 and 7.5 years when comparing gender groups. In Tower Hamlets, the gap between most and least deprived communities is 12.7 years across both gender groups, whilst the gap for men reaches up to 10 years and 6.5 years for women.
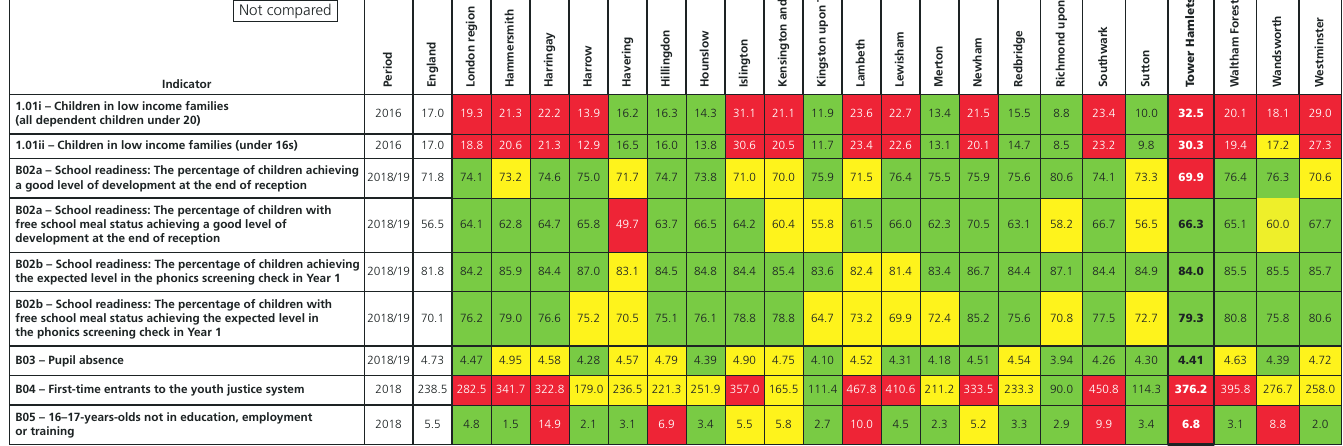
The 2019 health summary for Torbay shows that the area performs worse than the England average on several health indicators. Most of these are linked to economic deprivation and inequality.
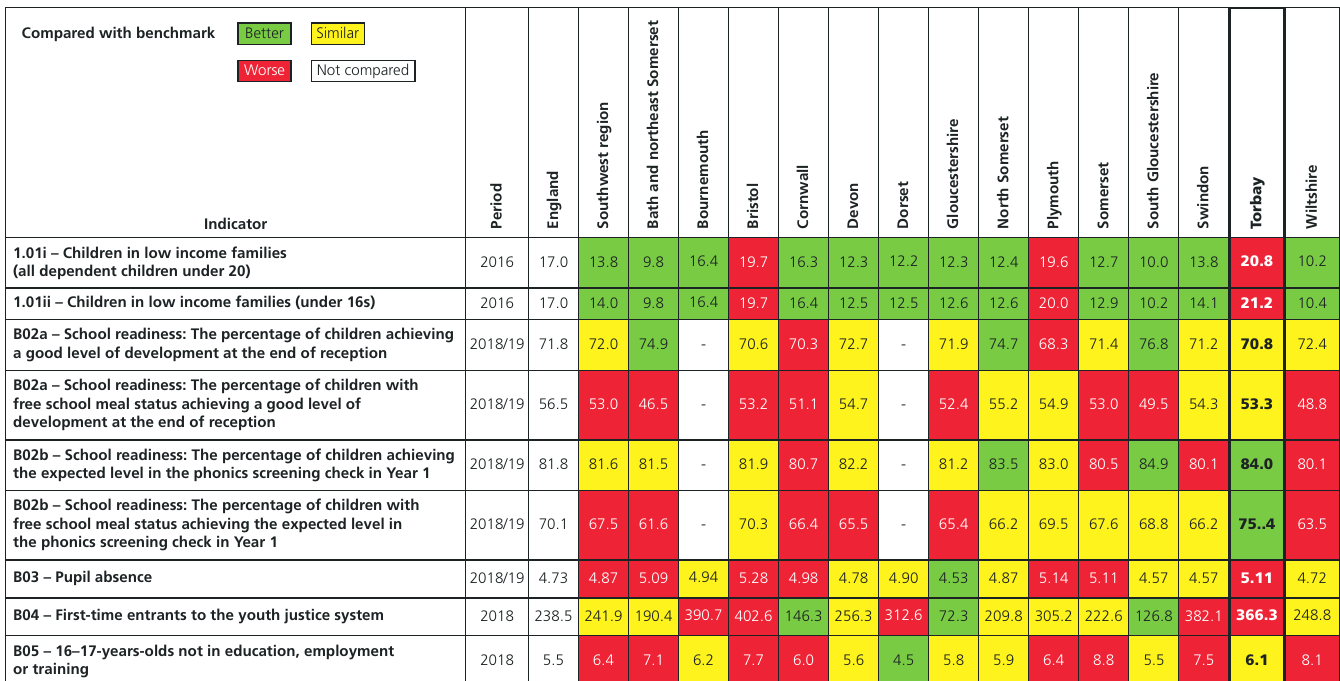
Health indicators in Tower Hamlets
The health summary for Tower Hamlets presents a more mixed picture. Whilst the district remains among the 20 per cent most deprived in England, some health indicators are worse than national averages whilst others are better. This perhaps reflects recent changes to the borough's population, with some areas experiencing investment and gentrification.
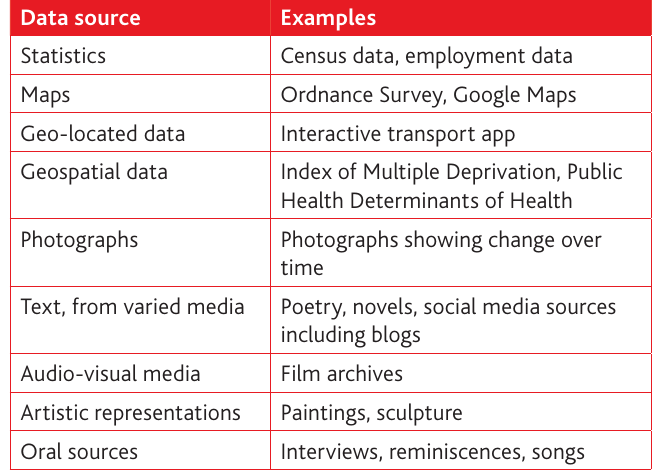
5. Representations of place
Representations of place come from various qualitative sources. These vary significantly depending on the place being investigated but may include novels, poetry, nature writing, travel writing, artistic works and media representations.
Historical development: Torquay
19th century growth
During the nineteenth century, Torquay grew from a small fishing village of 800 people into a fashionable seaside resort. John Bartholomew's Gazetteer of the British Isles (1887) described Torquay as "among the first of English watering places. Its mild and equable climate, its excellent water supply and drainage system, and its bright and pleasant surroundings make it a great resort of invalids and convalescents in winter and spring."
The Western Morning News described it in 1864 as "the most opulent, the handsomest and the most fashionable watering place in the British Isles." The resort attracted wealthy families, famous writers and even royalty.
Impact of the railway
The arrival of the railway in 1848 made travel more affordable and widespread. Torquay became more popular as a result. The term 'English Riviera' was adopted in the Victorian period as visitors likened the climate and topography of Torquay to the French Riviera resorts. This marketing term has been an important element in promoting the area ever since.
20th century decline
Torquay continued to expand as a tourist resort throughout the nineteenth and twentieth centuries, but like many British seaside resorts, the 1970s marked the beginning of a decline in tourist numbers.
Historical development: Brick Lane and Spitalfields
Early history
Brick Lane was originally called Whitechapel Lane but is thought to have been renamed because local earth was used by brick and tile manufacturers in the fifteenth century. By the seventeenth century, the street had also become a popular location for breweries.
Huguenot settlement
In the late seventeenth century, the area saw an influx of French Huguenots who had been driven out of France. The street and surrounding area became well known for weaving and tailoring. Like much of the East End, this area was also a haven for immigrants moving into London to escape persecution abroad or seeking a better life.
Jewish community
During the nineteenth and twentieth centuries, the area was best known for its Irish and Jewish population.
Bangladeshi community
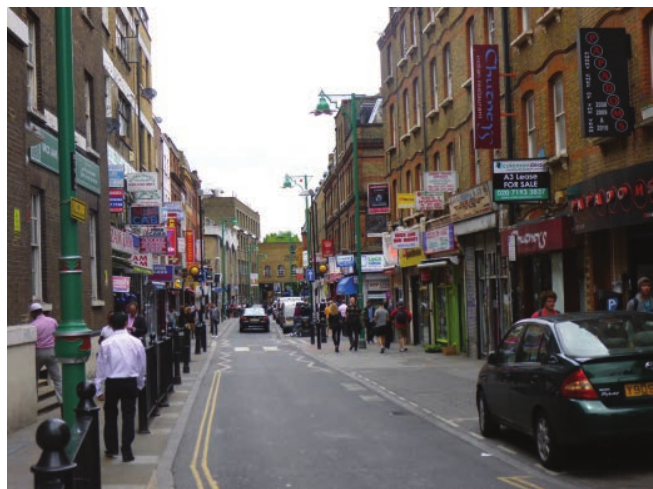
In the 1990s, the area became known as Banglatown as it was a popular place for immigrants from Bangladesh, particularly Bengalis from the Sylheti region. The weekly Bangladeshi paper, The Sylheter Dak, even had an office there. In the early 2000s, guidebooks claimed that the street was THE place to go for a curry in London, especially for traditional and authentic Bangladeshi cooking.
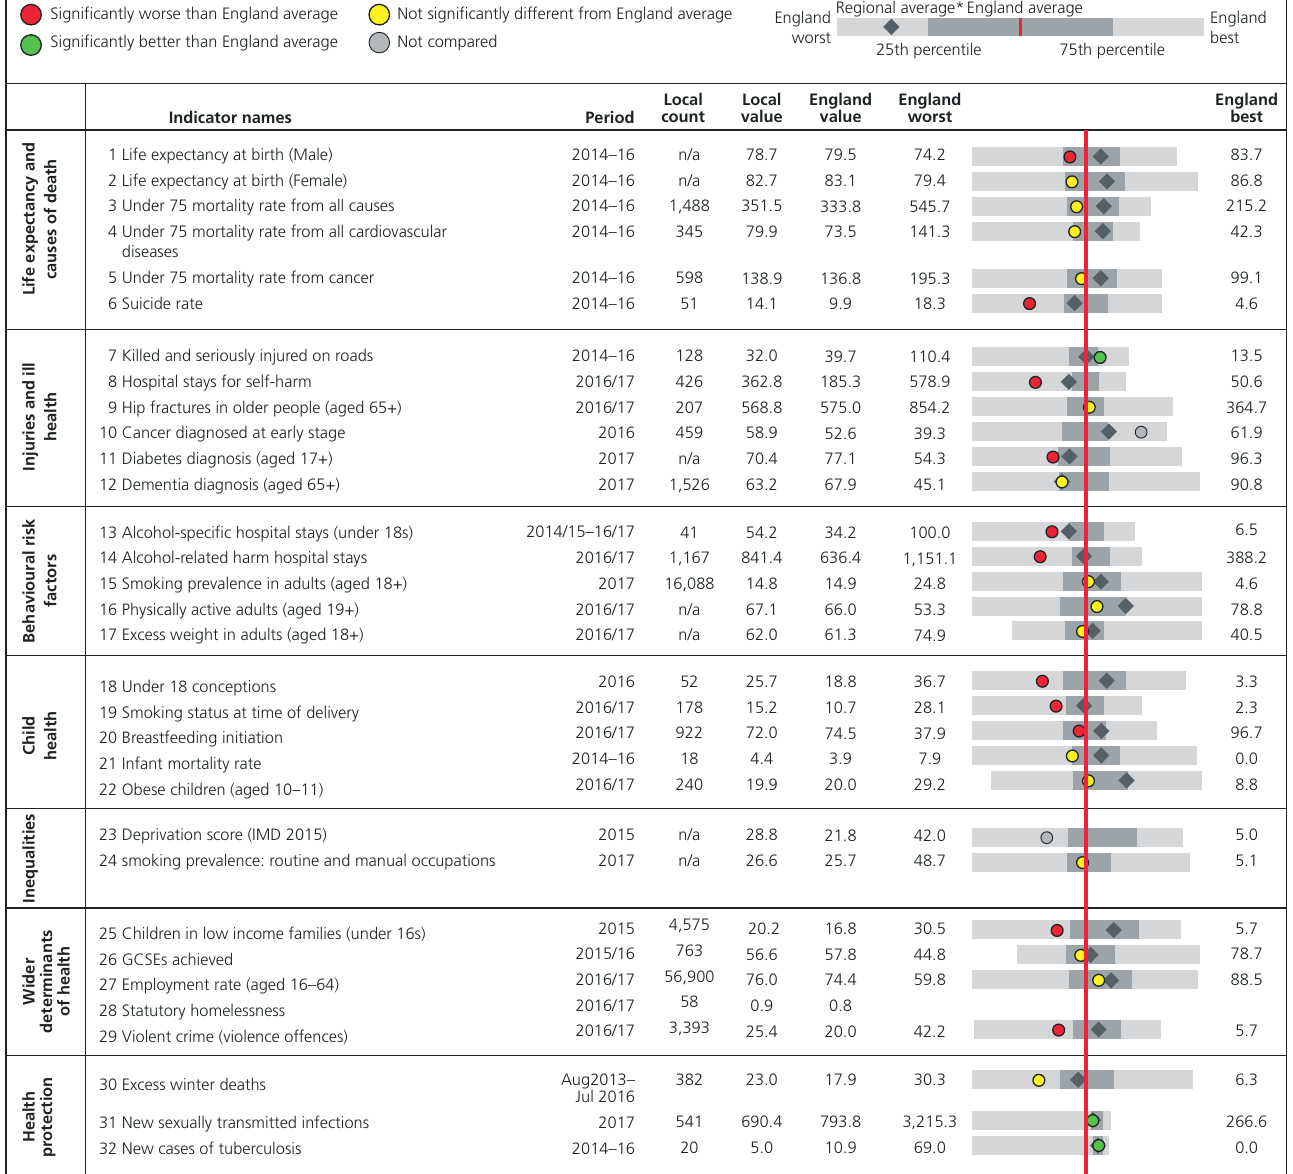
Evidence of the diverse communities that have shaped Brick Lane can be seen throughout the area - a Huguenot church, a Methodist chapel, a Jewish synagogue and Muslim mosque stand among traditional and new shops, restaurants, markets and homes.
Recent changes
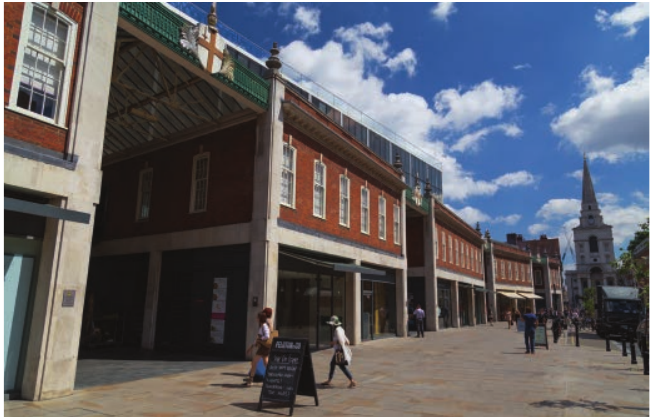
In recent times, the area has developed a vibrant art and fashion scene. The Old Truman Brewery has transformed vacant and derelict buildings into office, retail, leisure and event spaces.
6. Artistic and media representations
Artistic representations of Torquay
Early artistic images of Torquay focused on the attractive coastal scenery, which has been used effectively in marketing tourism.
Railway posters from the 1930s used idyllic images of sunny seaside holidays to inspire the public to travel to these destinations by train. More recently, resorts like Torquay, Paignton and Brixham have been actively marketed as the English Riviera, evoking a sense of Mediterranean warmth. The brand uses a strong graphic image of a palm tree, originally created by award-winning designer John Gorham in 1982, which quickly became the identifying icon for the English Riviera.

Media representations of Torquay
Media representations of Torquay have been mixed. For many people, Torquay will always be associated with the 1970s comedy series Fawlty Towers (BBC, 1975-1979), loosely based on an experience the actor John Cleese had whilst filming in Torquay and staying at the Gleneagles Hotel. The twelve episodes of Fawlty Towers were not actually filmed in Torquay.
A more positive representation comes from crime writer Agatha Christie, who was born in Torquay. The connection with Agatha Christie has been promoted to bring a "wider sense of glamour and style" to the Riviera brand. According to the English Riviera website, the International Agatha Christie Festival held in Torquay is "fast becoming one of the UK's leading literary festivals."
Public perceptions of Torquay are mixed. A survey for the Towards 2015 tourism report concluded that Torquay was perceived as having a "classy past but an unclear present", whilst a range of positive and negative comments can be found in online discussion forums.
Visitors to Torquay tend to be more complimentary. Typical posts from the TripAdvisor website refer favourably to the beautiful coastline, clean beaches and wide range of tourist attractions.
Artistic representations of Brick Lane
The area of Brick Lane and Spitalfields has developed a reputation for fashionable street art, particularly around Shoreditch. The Ravish London website suggests that this area constitutes "the Mecca of London street art; a de facto open-air gallery, a square mile of street art to compare with the financial square mile." The nearby area of Shoreditch saw an influx of artists such as Tracy Emin and Damien Hirst in the 1990s, and their success seemed to attract more artists to the area.
Spitalfields have also witnessed a huge increase in galleries opening, helped financially by the gentrification of the area and increasing tourist numbers. In 2011, local artist and cartographer Adam Dant unveiled his Map of Spitalfields Life. This map details key locations within the Spitalfields area today, but also provides historic background about various places. It includes characters who have made this area special, ranging from artist Tracey Emin to Fred the chestnut seller. Dant's map provides a very strong sense of place.
Media representations of Brick Lane
Media representations of Brick Lane are numerous and varied. The geographical area has numerous websites devoted entirely to it, detailing everything from the best curry houses to walking tours of the street art. The area has also become a popular tourist destination for visitors to London and features prominently in most guidebooks.
The Lonely Planet writes: "Full of noise, colour and life, Brick Lane is a vibrant mix of history and modernity, around a palimpsest of cultures. Today it is the centrepiece of a thriving Bengali community in an area nicknamed Banglatown. The southern part of the lane is one long procession of curry and balti houses intermingled with fabric shops and Indian supermarkets."
In contrast, the website of the Old Truman Brewery located in the northern half of Brick Lane describes itself as being "home to a hive of creative businesses as well as exclusively independent shops, galleries, markets, bars and restaurants."
Literary Representation: Monica Ali's Brick Lane
One of the more famous literary texts has been Monica Ali's novel Brick Lane, published in 2003 and subsequently made into a film (2007). The story follows the life of Nazneen, a Bangladeshi woman who moves to London at age 18 to marry. The fictional couple live in Tower Hamlets and the novel explores her new life in London and adaptations she makes as a Bangladeshi.
An extract from the novel illustrates the main features of Brick Lane and the changing prosperity of the area as it becomes a more fashionable neighbourhood:
"The bright green and red pendants that fluttered from the lamp posts advertised the Bangla colours and basmati rice. In the restaurant windows were clippings from newspapers and magazines with the name of the restaurant highlighted in yellow or pink. There were smart places with starched white tablecloths and multitudes of shining silver cutlery... 'You see,' said Chanu. 'All this money, money everywhere. Ten years ago there was no money here.'"
Monica Ali, Brick Lane
7. Other sources of lived experience
Surveys and questionnaires
Lived experience of place can be gathered from various sources:
Official surveys
In 2008, the Department for Communities and Local Government conducted a place survey to gauge people's perceptions of their local area and the services they received. In Torbay, 82 per cent of residents were very or fairly satisfied with their local area. This compared favourably with the national average of 80 per cent and was linked to the high quality of life afforded by the natural local environment and geography.
Since 2011, the Personal Well-being Survey has monitored personal well-being and life satisfaction. Geographical patterns have emerged from this survey, but the questions do not relate specifically to place.
Primary research
You might want to produce your own questionnaires or conduct interviews with local people about their lived experience or perceptions of place. Ask family and friends to participate, or post a questionnaire online. Social media sources such as Twitter, Facebook, Instagram and Pinterest can provide lived experience of place as people increasingly communicate online about places they have visited.
Make sure you acknowledge the strengths and weaknesses of each source when conducting primary research.
Blogs
Blogs can be excellent sources of information about an area. In East London, for example, The Gentle Author writes a daily blog about the culture of the Spitalfields area and documents the lives of local people and places. The Spitalfields Life blog was born in 2009 with the words: "In the midst of life I woke to find myself living in an old house beside Brick Lane in the East End of London." Today, thousands of people from around the world read each daily posting.
Sources showing economic and social change
Statistics, maps, newspapers, poems, photos and paintings are just some sources that can be used to show change in a place over time. Film or television footage may also be available for your local or distant place.
Photographic sources
Photographs can document change over time effectively. The official Spitalfields Market website shows the early market as a collection of sheds and stalls. A later photograph shows the market exterior after major regeneration. The website also documents changes in text, noting the market's evolution from selling fruit and vegetables in the seventeenth century to becoming a major tourist attraction today, where visitors "will find designers/makers and artists selling fashions, homewares and accessories or a treasure trove of vintage and antique clothing, furniture and other wondrous oddments."
Older photographs are available from the Tower Hamlets Local History Library and Archive and have been used to create a series of before and after photographs for the same street. The website http://spitalfieldslife.com/ is regularly updated and provides fascinating information about changes in this area.
Text sources
Gentrification can bring great wealth to an area but can also lead to the displacement of original residents as house prices rise and shops and services change to suit the tastes of the evolving socio-economic composition of the area.
National newspapers reported on a series of anti-gentrification protests in and around Spitalfields in September 2015. A series of letters written to The Guardian newspaper highlights major concerns about the impacts of gentrification in East London at this time:
"I was born in Whitechapel in 1974, to a family based in Shoreditch since the 1700s, and the stories and people, the spirit of that 1/4 square mile. Where historically class lines merged, cultures crossed, the rich brushed shoulders with Jack London. The hipsters have my approval for saving the architecture of the area, although I lay that more in the hands of the late 80s British art wave. But it's not the East End: inclusive, classless, tough, oozing character and fear in equal measure, pleasure and peril greeted every turn, never a yard from poverty or riches, sickness or health, life or death.
The current occupants have no verve or spirit, the survival with a smile has gone. It has always been driven by its association with the docks, the clay pits, the silk weavers; a hot bed of immigration and integration. But it no longer has a fraction of the character... only the scenery remains for us Londoners to easier imagine the feeling of being on the edge of something dangerous or amazing at every turn. Takes a bit more than a beard for that."
Another letter stated:
"I'm getting the impression that the 'them and us' mentality is coming from both sides. I live in Hackney with flatmates. None of us are born-and-bred Londoners, but have been here for some 3-8 years. They are British. I'm just a foreigner here for a while. None of us is a 'hipster' either... I live in East London because I like the diversity. Not sure where else I'd live, because whenever I go west, it seems so white and it's all coffee chains."
The Guardian website, 24 March 2015
These comments highlight some key issues concerning in-migration and gentrification in this area at the time. They serve as another record of people's lived experience of place.
Poetry
Poetry can provide powerful emotional responses to place. Sally Flood, a long-time East London resident, has written extensively about Brick Lane. Her poem captures a sense of place in her depiction:
Brick Lane is a mixture
of aromatic spices
Curries, onions and bad drains,
Pakistani restaurants
Jewish trimming shops
and betting shops,
Down-at-heel workers
and hopeful prostitutes,
cars and vans add to the pollution
with exhaust fumes.
Pavements and gutters
are littered with overspill
from dustbins and workshops.
This is where the immigrant
looks for fulfilment!
This is the breeding ground
for discontent,
Where the Meths drinker mixes
with the down-and-out,
Where Workers are exploited
and small-time drug peddlers
sell their dreams!
This is where the thug
dons the crown of King
and bullies thrive,
Where do-gooders
salve their consciences,
This is Brick Lane.
Sally Flood, 'The Brick Lane I see', Window on Brick Lane, 1980
Flood has also written about the changes occurring in her local landscape as a result of large-scale redevelopment:
This small street is fast receding
Growing smaller, day by day
Over years I watch it crumble
Watch the houses swept away,
Streets that share my childhood moments
Saw the war years, heard the bombs
Proudly held itself together
Now prepares itself to die.
Extract from 'Mount Terrace', Tales by Eastenders, 2015
Key Points to Remember:
- Place studies require detailed investigation using multiple data sources to avoid creating incomplete single stories about places
- Choose a manageable local place and a contrasting distant place that show significant differences in economic development, population density or cultural background
- Use a variety of quantitative sources including maps, census data, Index of Multiple Deprivation and health statistics to build demographic, economic and social profiles
- The Index of Multiple Deprivation measures relative deprivation across seven dimensions: income, employment, health, education, crime, housing barriers and living environment
- Explore qualitative representations of place through artistic works, media representations, literature, poetry, photographs and lived experiences to understand how places are perceived and experienced
- Both Torquay and Brick Lane/Spitalfields demonstrate how places change over time - Torquay through tourism decline and economic challenges, Brick Lane through successive waves of migration and recent gentrification