Qualitative Skills (AQA A-Level Geography): Revision Notes
Qualitative Skills
Qualitative skills are essential research methods in geography that help us understand the human experience of place. Unlike quantitative methods that focus on numbers and statistics, qualitative approaches explore people's feelings, opinions and perceptions of places. These methods are particularly valuable because they reveal what it is like to live in a place and how people experience their surroundings.
Maps and sense of place
How maps influence perception
Maps serve as powerful tools to locate places, but they also shape how we think and feel about them. Maps play a crucial role in both our sense of place (our emotional connection) and perception of place (how we view and understand places).
It is essential to critically examine how reliable and accurate maps are. Throughout history, maps have distorted reality for various reasons.
Historical bias in maps
Early world maps, such as the Mappamundi (dating from around 1300), depicted the world as a flat disc. These maps placed the Holy Land and Jerusalem at the centre, reflecting religious beliefs rather than geographical accuracy.
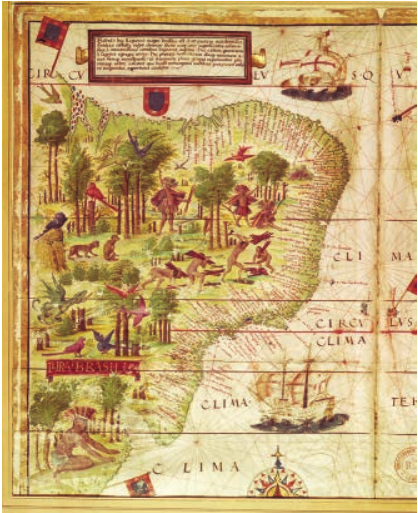
During the colonial expansion period, maps exaggerated the size of certain areas and resources. This made some regions appear more strategically important than they actually were. Early cartographers (map-makers) deliberately promoted imperial causes through their work, creating what was essentially propaganda.
Maps are not neutral documents. They often reflect the political, religious or economic interests of those who create them.
The Mercator projection
The Mercator map projection was first developed in the sixteenth century as a navigational tool for sailors. However, it contains significant distortions that affect how we perceive the world.
Three major problems with the Mercator projection:
-
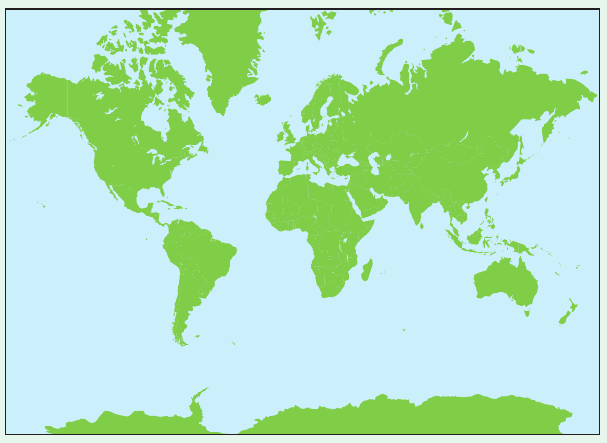
Size distortion: The projection distorts the relative size of land masses. For example, Greenland appears similar in size to Africa on the map, but in reality Africa is 14 times larger than Greenland.
-
Positioning bias: The projection reinforces the convention that the northern hemisphere sits at the top, even though there is no scientific reason for this orientation. The world does not come with a label saying "this way up."
-
Eurocentric focus: The map exaggerates the size of Europe and positions it in the middle of the map, suggesting European centrality and importance.
Despite these issues, you will commonly see the Mercator projection in classrooms and media, where it is often accepted without question as an accurate representation of the world. Educationalists have criticized its continued use because it does not accurately depict the size of the Earth's northern and southern latitudes.
Google Maps and hidden bias
Google Maps has become an invaluable tool for researching and finding information about places. However, it does not present information in a completely objective way.
Like any search engine, Google Maps filters results. It directs people towards businesses and places that have been optimized to appear prominently in search results. Places with better online presence are engineered to appear on the first page of searches, whilst others may be hidden.
Counter-mapping
Counter-mapping describes a bottom-up process where people produce their own maps, informed by their own local knowledge and understanding of places.
Counter-mapping offers an alternative to traditional, top-down cartography. It empowers communities to represent their own places based on lived experience rather than official or commercial interests. This approach can reveal aspects of place that conventional maps ignore or misrepresent.
Biomapping
What is biomapping?
Biomapping or emotional cartography is the mapping of emotions shown by people in certain places. It uses a device that records the wearer's Galvanic Skin Response (GSR) - a simple indicator of emotional response in conjunction with geographical location.
This method creates maps that visualise points of high and low feelings, providing quantifiable data about emotional responses to different places.
Case study: Stress tests with Nicholas Crane
In a 2015 episode of the television series Coast, researchers conducted stress tests on presenter Nicholas Crane. Geographer Jon Anderson measured the electro dermal activity (skin's energy) whilst Crane was in different locations.
Worked Example: Comparing Stress Levels in Urban vs. Coastal Environments
London experiment:
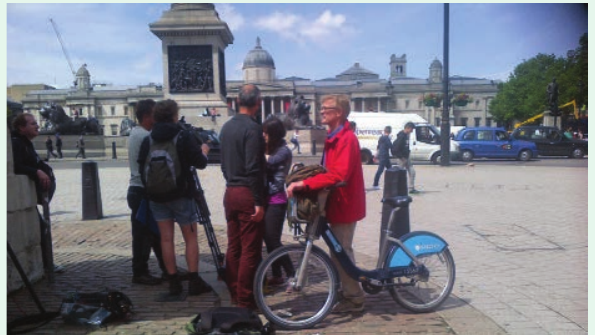
- Crane cycled a Boris-bike around Trafalgar Square
- He navigated the London Underground system
- Results showed very little variation in stress levels whilst walking around London
- Notable spikes in nervous energy occurred when he caught the underground train or crossed a busy road
- The peak stress level was recorded as he cycled around Trafalgar Square, contending with heavy traffic
Coastal experiment:
- Crane took an early evening stroll along the beach at Southend
- His stress levels were at their lowest
- This was attributed to the physical environment of the coast - a combination of natural elements including the hypnotic and soothing sound of the waves, the feel of the sand under his feet, and the sea breeze
Conclusion: The quantifiable data produced supported the widely-held cultural notion that going to the seaside is beneficial for wellbeing. The experiment demonstrated that different places can have measurably different effects on stress and emotional state.
Interviews
Interviews can generate detailed insights about a person's sense of place or perception of place. They provide first-hand accounts of how people experience their surroundings.
Advantages of interviews
- They provide first-hand or direct reports of experiences, opinions and feelings
- They can be structured (with pre-set questions) or unstructured (more like an everyday conversation)
- Unstructured interviews tend to be more informal, open-ended, flexible and free flowing
- They allow researchers to explore unexpected topics that emerge during conversation
Disadvantages of interviews
Key limitations to be aware of:
- Interviewer bias: The interviewer may affect the responses of the interviewee by using leading questions or by their manner and approach
- Presentation bias: People may not be completely honest as they like to present themselves in a favourable light. They may exaggerate positive aspects or downplay negative experiences
Ethnography
Ethnography is a research method that explores what people do as well as what they say.
To understand how different places are experienced and understood, ethnographers participate in the daily life of a person or group of people. This involves:
- Watching what happens
- Listening to what is said
- Asking questions
- Generally becoming part of that world
Ethnography provides deep, contextual understanding of how places are lived and experienced from an insider's perspective.
Media representation of place
Knowledge and understanding of place can be strongly influenced by diverse media including television, film, photography, art, books, newspapers and the internet. These sources are reaching an increasingly large, global audience and play an important role in shaping wider perceptions of place.
The power of media
Media representation has meant that geographical distance has become less of an obstacle for learning about places. People can gain instant knowledge about places from media sources, even if they have never visited them.
The notion of near and far places is becoming increasingly blurred. People develop attachments to places they have never physically visited, purely through media exposure.
Photographs
Photographs are particularly powerful in shaping perception of place. With modern photo-editing technology, people can easily manipulate images.
Key considerations:
- Places can be 'photoshopped' or filtered to make them appear different
- In tourist areas, photographs often look more attractive than reality
- The difference between a photograph and reality may be due to:
- Weather conditions on the day
- Time of day or season
- Deliberate editing to enhance colours, remove unwanted elements, or improve lighting
Marketing images for tourist places tend to focus on natural beauty or attractive landscapes whilst minimizing any disturbance from humans or development. The reality for many tourist destinations may be very different from these carefully curated images.
Geographical Information Systems (GIS)
GIS (Geographical Information Systems) refers to technology that allows geographical data to be collected, stored, analyzed and displayed. The expansion of GIS means that an increasing range of geographical data is now available for research and analytical purposes.
GIS technology has made comprehensive sets of geographical data widely accessible. It enables researchers to map and analyze patterns in ways that were previously impossible, supporting both qualitative and quantitative geographical research.
Key Points to Remember:
- Maps are not neutral - they reflect the interests and biases of their creators, from historical religious beliefs to modern commercial interests
- The Mercator projection distorts reality - it makes northern hemisphere countries appear larger than they actually are and reinforces Eurocentric perspectives
- Biomapping provides quantifiable data about emotional responses to places using Galvanic Skin Response (GSR) technology
- Different qualitative methods offer different insights - interviews provide first-hand accounts but may involve bias, whilst ethnography offers deeper contextual understanding through participation
- Media powerfully shapes perception of place - photographs, films and other media can blur the distinction between near and far places, and create perceptions that may differ significantly from reality