Social and Economic Issues (AQA A-Level Geography): Revision Notes
Social and Economic Issues
Understanding urban inequality
Cities across the globe experience significant inequality. The contrast between wealthy and poor residents can be dramatic, even across small geographical distances. This is particularly evident in rapidly growing cities in Asia, Africa and South America, where the wealth gap has widened considerably in recent decades.
When conducting fieldwork in urban areas, these disparities become immediately apparent. You can distinguish affluent neighbourhoods from struggling ones through visible indicators such as housing quality, environmental conditions and available services. The wealthy and poor often concentrate in different areas, creating a pattern known as social segregation.
Economic inequality
Economic inequality refers to the difference in living standards, income and economic resources across the population. In many developing world cities, this inequality has reached extreme levels. Mumbai provides a striking example of this phenomenon.
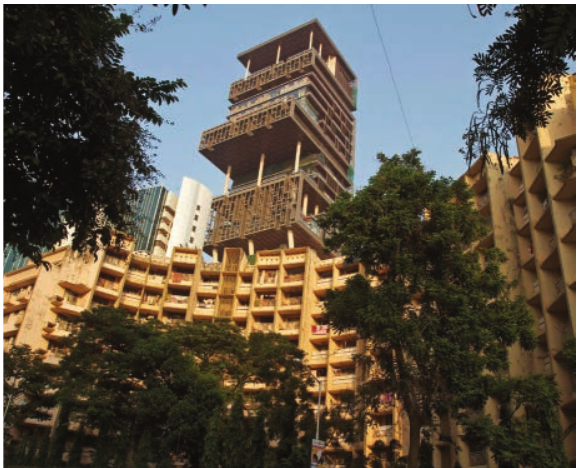
Case Study: Wealth Contrasts in Mumbai, India
Mumbai demonstrates one of the world's most dramatic wealth contrasts, illustrating extreme economic inequality within a single urban space.
The Wealthy:
- Antilia - a 27-storey private residence valued at over $1 billion (approximately £35 billion)
- Owned by Mukesh Ambani, chairman of a global energy company
- Features steel and glass construction, spectacular ocean views, swimming facilities, gym amenities and three helipads
The Poor:
- Byculla slum - home to part of Mumbai's nine million slum dwellers
- Located within a short distance of Antilia
- Most residents survive on less than $2 per day
This extreme juxtaposition illustrates how enormous wealth gaps can exist within a single urban space.
Key Definitions
Economic inequality – The difference between levels of living standards, income and other economic resources across the whole economic distribution.
Social segregation – When groups of people live apart from the larger population due to factors such as wealth, ethnicity, religion or age.
Cultural diversity – The existence of a variety of cultural or ethnic groups within a society.
Urban social exclusion – Economic and social problems faced by residents in areas of multiple deprivation.
Causes of social segregation
Several interconnected factors drive social segregation in urban areas. Understanding these mechanisms helps explain why wealth and poverty concentrate in distinct geographical areas.
Housing market dynamics
The housing market plays a fundamental role in creating segregated communities:
- Developers and builders typically focus on maximising profits, targeting specific market segments
- Requirements for 'affordable housing' may influence property values in some areas
- Wealthier groups can afford to pay premium prices for houses in desirable locations with high-quality environments and services (such as good schools and parks)
- Poorer groups have limited choice and must accept whatever housing they can afford
- This creates a pattern where affluent residents cluster in certain areas whilst poorer residents concentrate elsewhere
Changing neighbourhood environments
Urban neighbourhoods undergo constant transformation, which affects their social composition:
- Historical housing stock built for large families (such as Georgian and Victorian properties) may now be too large for average modern families
- Many such properties have been converted into Houses in Multiple Occupation (HMOs), often housing people on low incomes or students
- The 'right to buy' legislation of the 1980s transformed many council estates, as sitting tenants purchased their homes and often improved them
- Conversely, former poor areas may experience gentrification, where wealthier residents move in and property values increase
- These changes can either concentrate poverty or displace lower-income residents
Gentrification can create mixed outcomes: whilst it may improve the physical environment and attract investment, it can also displace existing low-income residents who can no longer afford rising housing costs and living expenses in their own neighbourhoods.
The ethnic dimension
Immigration patterns contribute significantly to segregation:
- When ethnic groups first arrive in a country as new immigrants, they often face discrimination in employment markets
- They may experience unemployment or only access low-paid work
- Limited financial resources mean they can only afford cheap housing or must rent privately
- Examples include Moss Side in Manchester and St Paul's in Bristol
- Newly arrived migrants tend to concentrate in poorer urban areas
- These ethnic groupings often cluster into multicultural neighbourhoods
- Such patterns frequently persist across multiple generations
Measuring poverty and inequality
The Index of Multiple Deprivation
The Index of Multiple Deprivation (IoD) is a UK government measurement system that assesses overall deprivation for every neighbourhood in England. The IoD2019 (most recent version) provides a comprehensive picture of how deprivation varies across the country.
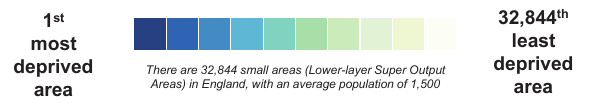
The index ranks all 32,844 Lower-layer Super Output Areas (LSOAs) in England from most deprived (rank 1) to least deprived (rank 32,844). Each LSOA contains an average population of approximately 1,500 people. This ranking system allows precise comparison of deprivation levels across different areas.
The seven domains of deprivation
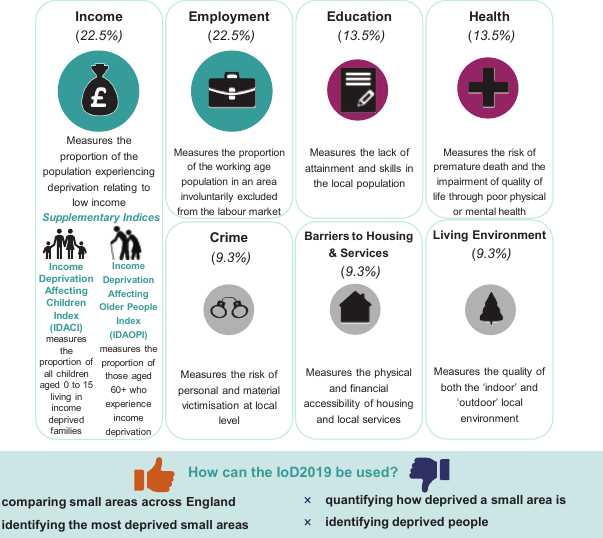
The IoD2019 combines 37 separate indicators across seven distinct domains, each weighted according to its importance:
Income (22.5% weighting)
- Measures the proportion of the population experiencing deprivation relating to low income
- Includes supplementary indices for children (IDACI) and older people (IDAOPI)
Employment (22.5% weighting)
- Assesses the proportion of the working-age population involuntarily excluded from the labour market
- Considers unemployment and inability to work due to illness or disability
Education, skills and training (13.5% weighting)
- Evaluates the lack of educational attainment and skills in the local population
- Examines both children and young people's education and adult skills levels
Health deprivation and disability (13.5% weighting)
- Measures the risk of premature death and impairment of quality of life through poor physical or mental health
- Considers both mortality rates and morbidity levels
Crime (9.3% weighting)
- Assesses the risk to personal and community safety
- Includes various categories of criminal activity affecting residents
Barriers to housing and services (9.3% weighting)
- Evaluates physical and financial accessibility of housing and key local services
- Considers both housing affordability and geographical access to essential services
Living environment (9.3% weighting)
- Measures the quality of the local environment
- Includes both indoor living conditions and outdoor environmental quality
These seven domains combine using appropriate weightings to produce the final Index of Multiple Deprivation score for each area. The system recognises that these statistics measure relative deprivation rather than absolute affluence.
Critical point: Not every person in a highly deprived area will necessarily be deprived themselves, and similarly, some deprived individuals live in the least deprived areas.
Geographical patterns of deprivation
The IoD2019 reveals several clear patterns of where deprivation concentrates in England:
- Large urban conurbations show high levels of deprivation
- Areas with historical heavy manufacturing industry or mining sectors (such as Birmingham, Nottingham and Hartlepool) experience significant deprivation
- Coastal towns (such as Blackpool and Hastings) feature prominently
- Parts of east London remain notably deprived
However, pockets of deprivation exist surrounded by less deprived places in every region of England. The geography is complex rather than simply divided between wealthy and poor regions.
Of the most deprived 10 per cent of neighbourhoods in England (3,284 areas), 137 rank as highly deprived on six of the seven domains. These neighbourhoods are not evenly distributed across England—88% or 64% of them concentrate within just eight local authority districts.
Urban social exclusion
Urban social exclusion describes the problems faced by residents in areas experiencing multiple deprivation. These individuals find themselves excluded from full participation in society due to their social and physical circumstances.
The effects of urban social exclusion are wide-ranging:
- Education barriers: Poor quality education or inability to access decent schooling limits life opportunities
- Employment challenges: Lack of qualifications makes securing decent employment difficult
- Housing problems: Only substandard, poor-quality housing is affordable
- Health impacts: Poor health outcomes result from environmental conditions and inadequate healthcare access
- Crime exposure: High crime levels create an unattractive and unsafe physical environment
- Limited social mobility: The combination of these factors traps people in a cycle of poverty that proves extremely difficult to escape
In urban areas, inequality can undermine social cohesion and in extreme cases lead to civil unrest.
The Cycle of Poverty: The combination of poor education, limited employment prospects, substandard housing, poor health and high crime creates a reinforcing cycle that traps people in disadvantaged circumstances that prove extremely difficult to escape.
Historical context: inner city decline
Inner city areas have traditionally been the most deprived urban neighbourhoods. The characteristic features of this decline resulted from de-industrialisation during the second half of the twentieth century. As manufacturing industries closed, unemployment became a major problem. Population loss followed as younger, more affluent and more skilled residents relocated to better opportunities, leaving behind an older, less skilled and poorer population.
Contemporary urban poverty patterns
However, the geography of urban poverty has evolved. The simple image of a deprived inner core surrounded by affluent suburbs no longer accurately reflects reality. Some of the highest levels of urban poverty now appear in peripheral estates, whilst many inner city areas have been transformed by regeneration schemes. Today, rich and poor areas are found across both city centres and suburbs.
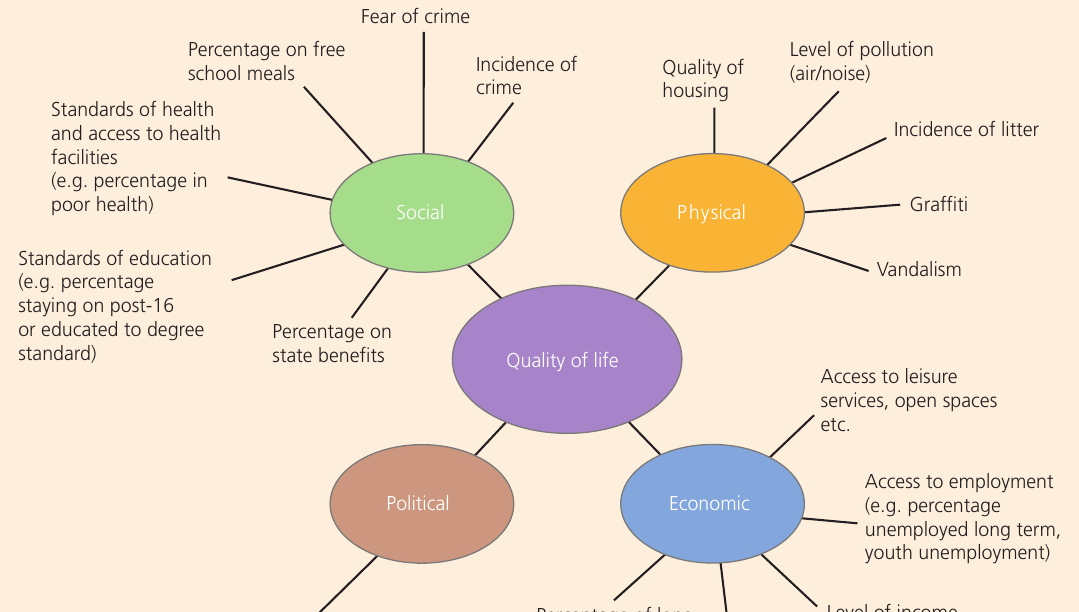
Quality of life
Quality of life is a multi-dimensional concept that encompasses various aspects of people's lived experience. It includes social, physical, economic and political dimensions:
Social dimension
- Health standards and access to healthcare facilities
- Education levels and quality
- Free school meals provision
- Fear of crime and actual crime incidence
- Percentage on state benefits
Physical dimension
- Housing quality
- Air and noise pollution levels
- Litter and environmental cleanliness
- Graffiti and vandalism presence
Economic dimension
- Access to employment opportunities
- Unemployment rates (particularly long-term and youth unemployment)
- Income levels
- Percentage of lone pensioners and lone-parent families
- Availability of leisure services
Political dimension
- Opportunities to participate in community life
- Ability to influence local decisions (such as voting in elections)
- Access to leisure services and open spaces
These dimensions interact to create the overall quality of life in any particular area. Areas experiencing multiple deprivation—a combination of social, environmental and economic deprivation—face the most severe challenges.
Poverty versus inequality
It is crucial to distinguish between these two related but different concepts:
Poverty is an absolute term. It refers to a level of deprivation that does not change over time. People in poverty lack basic necessities and resources.
Inequality is a relative term. It describes the differences between people in their economic circumstances over a geographical area or distribution. It measures the gap between different groups.
In practice, poverty and inequality often rise and fall together, but this relationship is not inevitable. A society can have high levels of inequality without widespread poverty if there is a large difference between the top and middle of the income spectrum. Conversely, inequality can be high in a society experiencing industrial decline, even with lower average wages.
Tackling poverty and inequality in cities
The main driver of urban inequality is wealth. Richer cities like London tend to have much higher rates of inequality, whilst more equal cities are typically smaller with lower average wages and are experiencing industrial decline.
National strategies
At the national level, redistributive tax systems can help reduce inequality. Progressive taxation (where higher earners pay proportionally more) redistributes wealth from rich to poor. However, at the local level within cities, the effects of such policies are less clear.
General strategies to reduce poverty and inequality include:
Enforcing a living wage or providing urban subsidies:
- In China, minimum wages have grown steadily
- By 2020, Shanghai had the highest minimum wage in China at US $358 per month
- Shenzhen and Beijing both reached US $318 per month
- Despite these urban increases, some rural areas still had wages as low as US $166 per month
Service provision challenges
Inequality also manifests in terms of access to opportunities and basic services:
- Job opportunities are more abundant and varied in wealthier cities
- Education quality varies significantly between areas
- Housing affordability differs dramatically
- Basic public services like water and sanitation in poorer cities are often inadequate
- In many poorer cities, adequate water and sanitation services primarily reach upper- and middle-class neighbourhoods
- Low-income neighbourhoods frequently depend on distant and unsafe water wells
- Informal accommodation in poorer areas often lacks any form of waste disposal
Breaking the Cycle: These service gaps perpetuate cycles of poverty. Poor health, higher unemployment and lack of social mobility trap people in disadvantaged circumstances that prove extremely difficult to escape.
Remember!
Key Points to Remember:
-
Economic inequality creates visible spatial segregation in cities, with wealth gaps particularly extreme in rapidly growing cities in Asia, Africa and South America.
-
Social segregation results from three main factors: housing market dynamics that concentrate wealthy and poor residents in different areas; changing neighbourhood environments through processes like gentrification and HMO conversions; and ethnic clustering patterns among immigrant communities.
-
The Index of Multiple Deprivation measures relative deprivation across seven weighted domains (Income 22.5%, Employment 22.5%, Education 13.5%, Health 13.5%, Crime 9.3%, Barriers to Housing & Services 9.3%, Living Environment 9.3%) and reveals that deprivation concentrates in large conurbations, former industrial areas, coastal towns and parts of east London.
-
Urban social exclusion traps residents in a cycle of poverty through combined barriers in education, employment, housing, health and exposure to crime, undermining social cohesion and in extreme cases leading to civil unrest.
-
Quality of life is multi-dimensional, encompassing social (health, education, crime), physical (housing quality, pollution, environmental conditions), economic (employment, income, services) and political (participation, influence) factors, with tackling inequality requiring both national strategies (living wages, redistributive taxation) and local service provision improvements.