Urban Waste (AQA A-Level Geography): Revision Notes
Urban Waste
Introduction to the urban waste challenge
Urban waste presents significant challenges for city authorities and planners worldwide. Poor waste disposal practices create links between waste and both air and water pollution, which negatively impact human health. The issue is becoming increasingly costly to address as landfill space diminishes and waste treatment through incineration requires substantial investment.
When biodegradable waste (particularly food and paper products) decomposes anaerobically, it releases methane (), a potent greenhouse gas. Current projections suggest that waste disposal sites will contribute 8-10% of global greenhouse gas emissions by 2025. Whilst recycling rates are rising, it is evident that much more action is needed to tackle the escalating waste crisis affecting cities across the globe.
Some experts argue that the first step in effective waste management is to stop referring to discarded materials as 'waste' - reframing our perspective can help shift thinking toward circular economy principles where materials are seen as resources rather than refuse.
Global trends in waste generation
Waste production is increasing dramatically across the world. Globally, waste grows by approximately 7% each year. Two primary factors drive this increase: population growth and economic development. As societies become wealthier, people consume more goods and services, which inevitably generates more waste.
Municipal solid waste (MSW) refers to waste generated by residents in urban areas. It is particularly high in cities where large concentrations of people live, and it is projected to increase significantly over the next decade as a result of urbanisation and rising living standards.
Statistical trends
The growth in urban waste generation can be tracked through specific data points:
- 2002: Urban residents globally generated approximately 0.64 kg of MSW per person per day
- 2012: This figure had increased to around 1.2 kg per capita per day, with approximately 3 billion urban residents contributing to this total
- 2025 (projected): Predictions indicate 4.3 billion urban residents will generate about 1.42 kg per capita per day of municipal solid waste
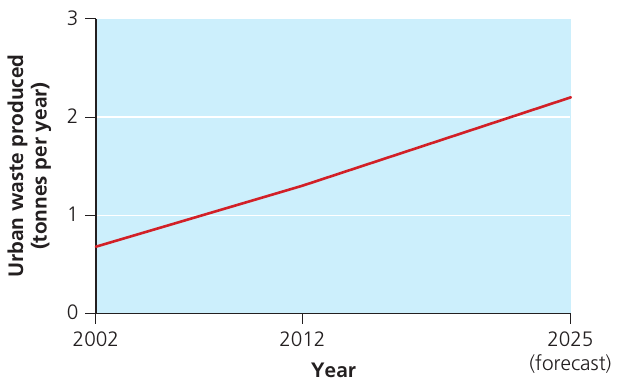
The steady upward trend clearly demonstrates that urban waste is recognised as an 'urban issue'. Urban residents produce roughly twice as much waste as their rural counterparts. This difference exists because rural dwellers tend to be less wealthy, purchase fewer packaged products, and have higher rates of reuse and recycling.
Variations in waste generation between cities
Waste generation differs considerably between cities depending on their level of economic development. As the data shows, there are stark contrasts in both current waste production and projected future trends.
Income-based differences
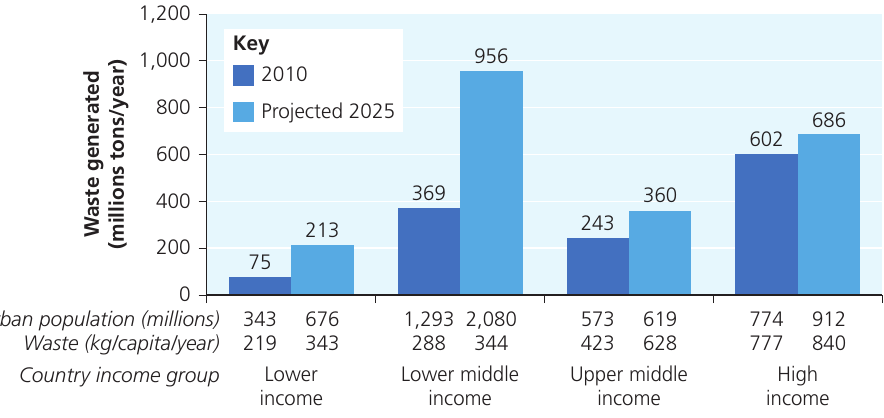
In 2010, waste production rates were substantially higher in cities located in high-income countries. This pattern reflects the reality that waste generation tends to increase where disposable incomes and living standards are higher. However, the most significant projected increases in waste generation are occurring in low and middle-income countries. These nations are experiencing rapid urbanisation and continued industrialisation, which drives waste production upwards.
Key comparisons include:
- Lower income countries: In 2010, 343 million urban residents generated 75 million tonnes of waste (219 kg/capita/year). By 2025, 676 million residents are projected to generate 213 million tonnes (343 kg/capita/year).
- Lower middle income countries: The most dramatic increase is expected here, from 369 million tonnes in 2010 to 956 million tonnes by 2025, with waste per capita rising from 288 to 344 kg/capita/year.
- Upper middle income countries: Waste is projected to increase from 243 million tonnes (423 kg/capita/year) to 360 million tonnes (628 kg/capita/year).
- High income countries: Despite already high levels, waste will continue to grow from 602 million tonnes to 686 million tonnes between 2010 and 2025.
Municipal solid waste is growing fastest in China, which is already the world's largest waste generator. By 2030, China's volume of MSW is projected to double that of the USA.
The tipping point phenomenon
The Tipping Point
Research on urban waste management has identified a tipping point - a threshold level of economic development where consumption patterns begin to significantly outpace sustainability. In Asia, this tipping point appears to occur at a per capita GDP of around US $20,000.
An interesting finding from comparative studies shows that both wealthier and poorer cities within a region often perform worse than middle-income ones in waste management.
Comparative Example: Water Use and Waste Generation in Asian Cities
Looking at three cities with different income levels:
- Kuala Lumpur (middle-income): Residents use 497 litres of water daily and produce 816 kg of waste yearly
- Singapore (high-income): Residents use 309 litres of water and produce 307 kg of waste annually
- Delhi (lower-income): Residents use 209 litres of water and produce 147 kg of waste yearly
This data suggests that somewhere in the midst of economic growth, consumption overtakes sustainability, and this pattern persists until cities become comparatively wealthy.
Composition variations
The composition of waste varies according to several factors including economic development level, cultural norms, geographical location, energy sources, climate, and the extent of urbanisation. As populations become wealthier and consume more, the proportion of inorganic materials (such as plastics, paper and aluminium) increases, whilst the relative organic proportion decreases.
Generally, low and middle-income countries have a high percentage of organic matter in their urban waste stream, ranging from 40% to 85% of the total. This high organic content has important implications for waste management strategies, as organic waste decomposes and produces methane when disposed of in landfills.
Sources of urban waste
Urban waste comprises millions of separate waste items generated by different sectors of society. Understanding these sources is essential for developing effective management strategies.
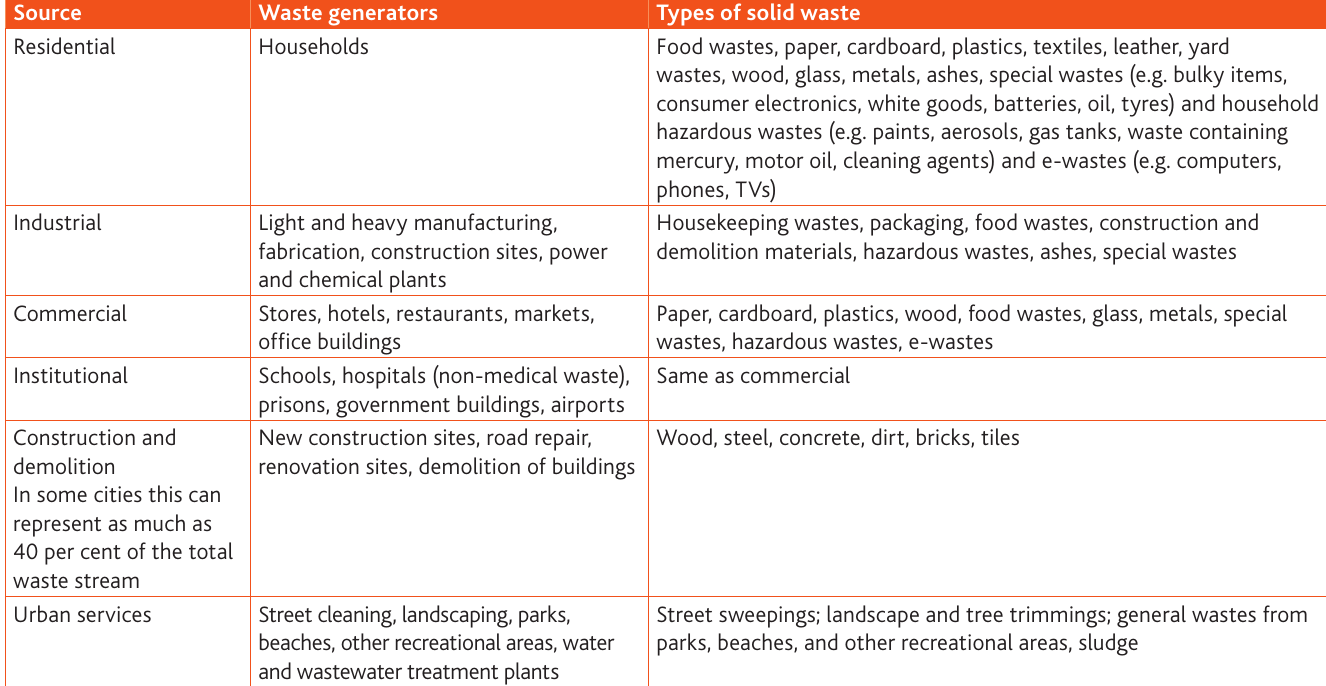
The six main categories of urban waste sources are:
Residential waste
Households generate food waste, paper, cardboard, plastics, textiles, leather, yard waste, wood, glass, metals, ashes, and special wastes. Special wastes include bulky items, consumer electronics, white goods (appliances), batteries, oil, tyres, and household hazardous wastes such as mercury, motor oil, cleaning agents, aerosols, gas tanks, and waste containing mercury. Additionally, e-waste (computers, phones, televisions) is a growing concern.
Industrial waste
Light and heavy manufacturing facilities, fabrication plants, construction sites, power stations and chemical plants produce housekeeping wastes, packaging, food wastes, construction and demolition materials, hazardous wastes, ashes, and special wastes.
Commercial waste
Shops, hotels, restaurants, markets, and office buildings generate paper, cardboard, plastics, wood, food wastes, glass, metals, special wastes, and hazardous wastes. E-waste is also a significant component of commercial waste streams.
Institutional waste
Schools, hospitals (excluding medical waste), prisons, government buildings, and airports produce similar waste to commercial establishments.
Construction and demolition waste
New construction sites, road repairs, renovation sites, and building demolitions create waste including wood, steel, concrete, dirt, bricks, and tiles. This category is particularly significant as it can represent up to 40% of the total waste stream in some cities.
Urban services
Street cleaning, landscaping, parks maintenance, beaches, other recreational areas, water and wastewater treatment plants generate street sweepings, landscape and tree trimmings, general waste from parks and beaches, and sludge from treatment facilities.
Impacts of increasing waste generation
The rising volume of urban waste creates multiple interconnected problems for cities worldwide.
Economic costs
The financial burden of collecting and treating waste is substantial. In lower-income countries, solid waste management is typically a city's single largest budgetary item. It is common for urban authorities to spend between 20-50% of their budget on solid waste management. This diverts resources from other essential services and infrastructure development.
Environmental impacts
Waste is a major source of methane, a powerful greenhouse gas with a much stronger warming effect than carbon dioxide. Waste also contributes significantly to water pollution, ground contamination, and air pollution. Refuse sites that produce 8-10% of global greenhouse gas emissions by 2025 represent a serious climate concern.
Untreated or uncollected waste leads to environmental degradation through contamination of groundwater and surface water by leachate (liquid that has percolated through waste and extracted dissolved or suspended materials). Air pollution results from burning waste that is not properly collected and disposed of.
Health risks
Inadequate waste management creates severe health hazards. Uncollected waste can lead to respiratory ailments, diarrhoea, cholera, and dengue fever. When waste is not properly collected and disposed of, it becomes a breeding ground for insects, vermin, and scavenging animals. These vectors can then transmit air-borne and water-borne diseases to human populations.
Critical Health Statistics
Research conducted by UN-Habitat in 2009 found that in areas where waste is not collected frequently:
- The incidence of diarrhoea is twice as high
- Acute respiratory infections are six times higher
These stark differences demonstrate the direct link between waste management quality and public health outcomes.
Infrastructure and capacity challenges
Many city authorities are struggling to collect increasing quantities of urban waste. The 2012 World Bank report on waste management found that 30-60% of urban solid waste in lower-income countries remains uncollected.
Case Study: Cairo's Informal Waste Collection System
Egypt generates approximately 80 million tonnes of solid rubbish per year according to government figures. The country's inadequate waste infrastructure is supplemented by the Zabaleen, Cairo's informal waste collectors. Each morning across Cairo, these collectors gather huge amounts of rubbish which women and children then sort through at home.
Cities are also running out of landfill space.
Case Study: Borj Hammoud Landfill, Beirut, Lebanon
The Borj Hammoud landfill in Beirut was planned to close in 2019. However, this closure has been delayed due to a nearly 30% reduction in daily waste production following mass protests and the COVID-19 lockdown. Permission has since been granted to raise the landfill by a further 2 metres.
Following a waste crisis in 2015, when rubbish was piled up in the streets, the government proposed expanding existing sites. Local residents fear that the odours being emitted by the site are toxic pollutants. Long-term exposure to these strong odours has been linked to:
- Respiratory diseases
- Allergies
- The spread of bacteria
Additionally, water that has leached from the present site is being dumped into the sea, polluting the water and making surrounding areas dangerous for swimming.
Approaches to waste management and disposal methods
The waste management hierarchy
Waste management generally follows an accepted hierarchy. The key target is to reduce the amount of waste produced initially. This can be achieved through a combination of waste-related legislation, education programmes, and financial incentives. At the other end of the spectrum, waste disposal occurs through incineration or landfill.
Methods in high-income countries
Landfilling and thermal treatment of waste (incineration) are the most common disposal methods in high-income countries. These approaches require significant infrastructure investment and regulatory oversight to ensure environmental and health standards are met.
Methods in low and middle-income countries
Most low and middle-income countries dispose of their waste in open dumps. Some of this disposal may be unregulated, meaning it is not controlled or supervised by regulation of law.
Unregulated Disposal: Definition and Consequences
Unregulated disposal refers to waste disposal that is not controlled or supervised by regulatory law. Solid waste that is not properly collected and disposed of can become a breeding ground for insects, vermin, and scavenging animals, which can then transmit air-borne and water-borne diseases.
When waste is not properly collected and managed, the consequences are severe:
- Solid waste becomes a breeding ground for disease vectors
- Insects, vermin, and scavenging animals spread diseases
- Diarrhoea incidence doubles in areas with poor collection
- Acute respiratory infections are six times higher
- Environmental threats include groundwater and surface water contamination by leachate
- Air pollution from improper burning of uncollected waste
- Health risks from toxic emissions at poorly managed dump sites
The survey data demonstrates that in areas where waste is not collected frequently, health outcomes deteriorate significantly. Environmental threats compound these health risks through multiple pathways of contamination.
Key Points to Remember:
-
Urban waste is growing globally at approximately 7% per year, driven by population growth and economic development.
-
Low and middle-income countries, particularly in Asia, are experiencing the fastest increases in waste generation due to rapid urbanisation and industrialisation.
-
The composition and volume of waste varies significantly by income level - high-income countries currently produce more per capita, but middle-income countries are catching up rapidly.
-
A tipping point occurs at around $20,000 GDP per capita where consumption patterns begin to significantly outpace sustainability.
-
Construction and demolition waste can represent up to 40% of total waste in some cities, alongside waste from residential, industrial, commercial, institutional, and urban service sources.
-
The impacts of inadequate waste management are severe: it consumes 20-50% of city budgets in lower-income countries, contributes 8-10% of global greenhouse gas emissions, and causes serious health problems including doubled rates of diarrhoea and six-fold increases in respiratory infections in areas with poor collection services.
-
30-60% of urban solid waste in lower-income countries remains uncollected, creating significant environmental and health hazards.