International Trade and Markets (AQA A-Level Geography): Revision Notes
International Trade and Markets
Introduction to international trade
International trade forms the backbone of the modern global economy. Countries participate in trade because of the principle of comparative advantage - this economic theory explains that nations benefit when they specialise in producing goods and services they can make most efficiently, then exchange these with other countries for products they're less efficient at producing. This specialisation allows for greater overall production and efficiency globally.
The global trading system operates through a rules-based framework governed by the World Trade Organization (WTO). This organisation works to lower barriers between countries and facilitate smoother international commerce. Through this system, countries can trade with confidence, knowing there are established procedures and agreements in place.
Multilateral trade agreement - A trade agreement negotiated between more than two countries or groups of countries at the same time, usually facilitated by the WTO.
This approach differs from bilateral agreements (between two countries) by allowing multiple nations to negotiate terms simultaneously, creating broader trading networks and more consistent rules across participating countries.
Regional trade agreements (RTAs) have also emerged as an important feature of global trade. These agreements between neighbouring countries or economic blocs help strengthen trading relationships within specific geographical areas.
Barriers to trade and protectionism
While free trade principles suggest that removing obstacles to trade benefits everyone, governments still impose various restrictions on international commerce. These barriers protect domestic industries from foreign competition, though they can reduce overall economic efficiency.
Key Definition: Tariff
A tariff is a tax imposed on imported goods. It remains the most common form of trade barrier used by governments worldwide.
Tariffs increase the price of imported products, making domestic alternatives more competitive even if they're less efficiently produced.
Types of trade barriers
Despite the WTO's efforts to promote free trade, governments employ several protectionist strategies:
Import licence: National governments issue these documents to authorise the importation of specific goods from particular sources. This gives governments direct control over which products enter their country and from where.
Import quota: These restrictions set physical limits on how much of a particular product can be imported within a defined time period. Unlike tariffs which allow unlimited imports at a higher price, quotas create absolute caps on quantities.
Subsidies: Governments provide these financial grants to domestic producers, reducing their production costs and making them more competitive against foreign imports. This indirect form of protection doesn't directly restrict imports but makes them less attractive to consumers.
Sanctions: Countries or international organisations implement these export restrictions for political purposes rather than economic ones. Sanctions help maintain international peace and security by pressuring governments to change their behaviour.
Embargoes: These represent more severe restrictions, involving partial or complete prohibition of trade with specific countries. Governments typically impose embargoes for political rather than commercial reasons, often as punishment or pressure tactics.
Regulatory or technical restrictions: These barriers use quality standards, production methods, or other technical requirements to limit imports. For instance, the European Union restricts imports of goods produced using child labour, regardless of the product's quality or price.
Understanding Protectionism
While these barriers may seem to contradict free trade principles, governments justify their use for several reasons:
- Protecting emerging domestic industries ("infant industries")
- Maintaining national security
- Preserving jobs in strategic sectors
- Enforcing ethical or environmental standards
However, economists generally agree that excessive protectionism reduces overall economic efficiency and consumer welfare.
Trends in volume and pattern of international trade and investment
Volume and pattern of trade
The late twentieth century witnessed a significant shift towards free market principles, leading to efforts to dismantle existing trade barriers. This liberalisation coincided with increased mobility of production factors, particularly capital. Regional trade agreements emerged and strengthened, while the WTO continued working to reduce barriers globally with free trade as its central aim.
However, reaching comprehensive trade agreements has proven challenging. In 2018, world merchandise trade reached $19.48 trillion, representing only a $0.50 trillion increase from 2013 figures. Global services trade grew to $5.8 trillion in 2018, showing modest growth from five years earlier. Trade growth has stalled in recent years, with international flows fluctuating considerably.
Factors Slowing Trade Growth
Several critical factors explain why trade growth has stalled:
- Economic recessions inevitably reduce international trade volumes
- The 2008-2009 global financial crisis had lasting impacts
- The COVID-19 pandemic caused a major decline in trade, with recovery expected to take a decade
- Growing protectionist sentiment in the USA and parts of Europe threatens further liberalisation
- Multilateral agreements on a global scale have become increasingly difficult to achieve
Factors driving current trade patterns
The pattern of global trade has evolved significantly due to greater economic integration and the increasing complexity of global supply chains. Modern manufactured products, such as cars, often have thousands of components produced in different locations worldwide before final assembly. This complexity creates intricate trade patterns driven by several key factors:
Comparative advantage: Countries specialise in producing and exporting goods they can manufacture most efficiently at lower costs. This fundamental principle continues to shape global trade flows.
Proximity: Countries tend to trade more with their neighbours. Geographic closeness reduces transportation costs and often means shared cultural, historical or linguistic connections. This proximity advantage helps explain why trade frequently operates on a regional basis, with intra-regional trade dominating global patterns.
Transport costs and cultural factors: Beyond pure distance, the difficulty and expense of moving goods influences trade patterns. Cultural and historical ties between countries also affect trading relationships.
Agglomeration: Certain industries cluster in specific geographical areas because sharing regional skills and information reduces costs. This concentration creates natural centres of production for particular goods.
Market size and strength: Exporters naturally gravitate towards larger, wealthier and growing markets where potential sales volumes and values are greatest. This factor explains why major economies attract disproportionate trade flows.
Geopolitical relationships: Political alliances strongly influence which countries trade with each other. Conversely, political conflicts can lead to sanctions or embargoes that disrupt trade. These relationships often override purely economic considerations.
Regional trade patterns
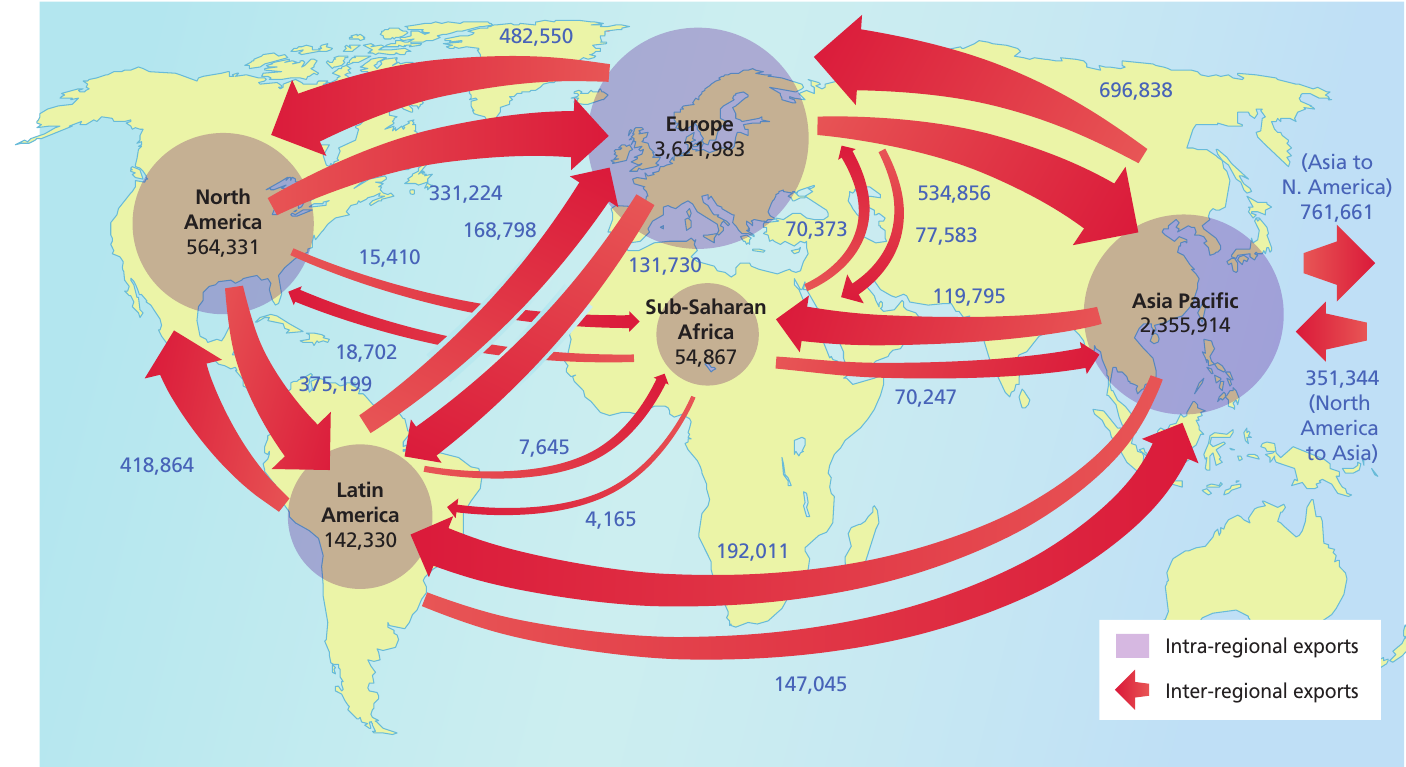
Geographically, global trade remains concentrated among a few major economic blocs: North America, Europe and the Asia-Pacific region. The Asia-Pacific has become the fastest-growing trading region, with China surpassing the United States as the world's largest trader by 2018.
Analysis of 2016 trade flows reveals several important patterns:
Intra-regional trade: Trade within the same region is particularly strong in Europe and the Asia-Pacific. North America also demonstrates robust intra-regional trade, though to a lesser extent. Europe's intra-regional trade reached $3,621,983 million, whilst the Asia-Pacific region recorded $2,355,914 million.
Understanding Trade Terminology
- Intra-regional trade: Trade between countries within the same geographical region (e.g., France trading with Germany within Europe)
- Inter-regional trade: Trade between countries from different geographical regions (e.g., China trading with the USA across Asia-Pacific and North America)
Intra-regional trade often benefits from lower transport costs, shared regulations, and regional trade agreements.
Inter-regional flows: The strongest inter-regional connections exist between:
- Asia-Pacific and Europe
- Asia-Pacific and North America
- North America and Europe
Regional disparities: Latin America and Sub-Saharan Africa show much lower levels of intra-regional trade. Most trade from these regions consists of imports and exports with other world regions rather than within their own areas. Latin America maintains its strongest trade relationships with North America, though connections with Europe and Asia-Pacific are also significant.
Trade imbalances: North America (primarily the USA) runs a trade deficit with all other regions, whilst the Asia-Pacific region maintains a trade surplus with all other regions.
Future Trade Pattern Shifts
Future developments may reshape these patterns significantly. Growing protectionist sentiment in the USA and parts of Europe could prompt these regions to reduce global integration. If this occurs, stronger trading connections between the Asia-Pacific region, Africa and Latin America will likely develop, potentially transforming global trade patterns dramatically.
Trends in investment
Foreign direct investment (FDI) provides crucial funding for development across all countries, but particularly for developing and least developed economies seeking to grow. Whether countries are just beginning to modernise or wealthy OECD members, achieving economic growth without capital injection proves extremely difficult.
In 2019, global FDI inflows totalled $1.39 trillion, marking the fourth consecutive year of decline. FDI to developed economies dropped to $640 billion, whilst flows to developing economies remained relatively stable at approximately $750 billion. A 2019 UN Conference on Trade and Development (UNCTAD) report identified several key trends:
- Developing countries receive nearly twice as much FDI as they invest overseas
- FDI from North America has declined significantly
- The Asia-Pacific region accounts for 40 per cent of global FDI inflows
- Eight of the top 20 FDI recipients were developing economies
- Japan, China and France were the largest sources of FDI
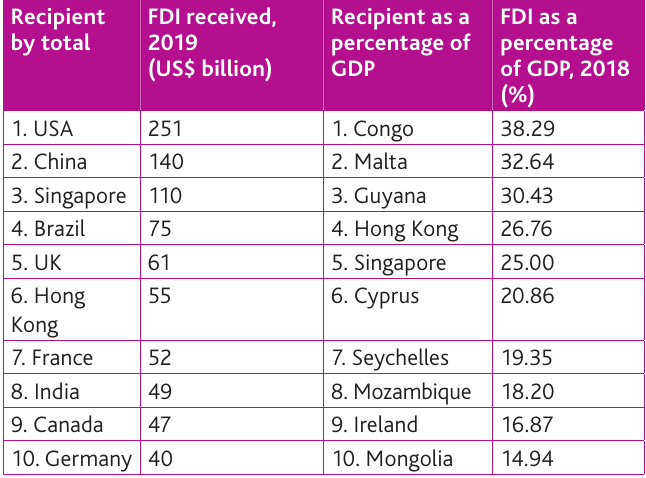
Interpreting FDI Data
The table reveals interesting patterns when comparing absolute FDI received versus FDI as a percentage of GDP. Countries receiving the most FDI in absolute terms (USA, China, Singapore) differ significantly from those where FDI represents the largest proportion of their economy (Congo, Malta, Guyana).
This distinction highlights that whilst large economies attract massive investment volumes, FDI has relatively greater impact on smaller economies where it represents a substantial share of total economic activity.
Main attractions for foreign direct investment
Several factors attract FDI to particular locations, though often a combination of elements proves decisive:
Manufacturing industries: Foreign motor companies investing in production facilities in the USA and UK represent classic examples of manufacturing FDI. Offshoring and outsourcing manufacturing operations to China and India have also attracted substantial foreign investment.
Natural resource development: Investment from mining corporations in countries like Brazil, Congo, Guyana and Mongolia seeks to exploit valuable mineral and resource deposits.
Financial and business services: Major financial centres such as Singapore and Hong Kong attract significant investment due to their sophisticated financial infrastructure and business-friendly environments.
Large and accessible consumer markets: Both manufacturers and service providers invest in locations offering access to substantial customer bases. The European Union, as a single market of 500 million people, exemplifies this attraction. Countries can leverage their market size as a key advantage.
Lower business taxes: Countries like Ireland and Cyprus attract investment by offering relatively low corporate tax rates. Combined with access to the large EU market, this tax advantage demonstrates how multiple factors work together to draw foreign investment.
Worked Example: Why Ireland Attracts FDI
Ireland demonstrates how multiple factors combine to attract foreign investment:
Step 1: Identify the individual attractions
- Corporate tax rate of 12.5% (lower than most EU countries)
- English-speaking workforce with high education levels
- Access to EU single market (500 million consumers)
- Strong technology and pharmaceutical clusters
Step 2: Analyse the combined effect These factors work synergistically - the low tax rate attracts initial interest, the skilled workforce enables operations, and EU market access provides the customer base. This combination has made Ireland one of Europe's largest FDI recipients.
Result: Major technology companies (Google, Facebook, Apple) and pharmaceutical firms have established European headquarters in Ireland, demonstrating how strategic positioning across multiple factors creates powerful investment attractions.
Remember!
Key Points to Remember:
-
Comparative advantage drives international trade - countries specialise in what they produce most efficiently and trade for other goods, creating mutual benefits
-
Multiple barriers to trade exist - despite free trade ideals, governments use tariffs, quotas, subsidies, sanctions and regulations to protect domestic industries
-
Global trade has stalled recently - world merchandise trade reached only $19.48 trillion in 2018, with growth hampered by economic crises and rising protectionism
-
Regional patterns dominate trade flows - intra-regional trade is strongest in Europe and Asia-Pacific, whilst Latin America and Sub-Saharan Africa trade more with other regions
-
FDI flows favour developing economies - developing countries received $750 billion in 2019, nearly twice what they invested overseas, with the Asia-Pacific region attracting 40% of global FDI
-
Six key factors shape trade patterns - comparative advantage, proximity, transport costs, agglomeration, market size, and geopolitical relationships all influence where and how countries trade