Models of Natural Population Change (AQA A-Level Geography): Revision Notes
Models of natural population change
Introduction to population models
A model is a simplified representation of real-world processes and relationships. In geography, models help us understand patterns and characteristics that occur in reality. Population geographers use various models to characterise how populations change over time and what impacts these changes have on societies.
This section explores two key ideas:
- The demographic transition model (DTM) - which shows how populations grow over time
- Population pyramids - which represent the age and gender structure of a population at any moment in time
These two concepts are interconnected. Whilst the DTM considers how populations change, population pyramids are dynamic structures that evolve as each generation moves through different life stages.
The demographic transition model (DTM)
What is the demographic transition model?
Demographic transition model (DTM): A model that records changes in birth rates and death rates in industrialised countries since the start of the Industrial Revolution. It traces the shift from high birth and death rates to low birth and death rates as a country develops from a pre-industrial economy to an industrialised economic system.
The DTM was developed by American demographer Warren Thompson in 1929 and 1948. It provides a framework for understanding how populations in different countries change at different rates. The speed of transition varies from country to country, and nations can be located at different stages along this continuum at any one time.
The model can be linked to the epidemiological transition (which explains changing patterns of disease and mortality). Both models help explain the different stages and changes in population that countries experience.
The five stages of the DTM
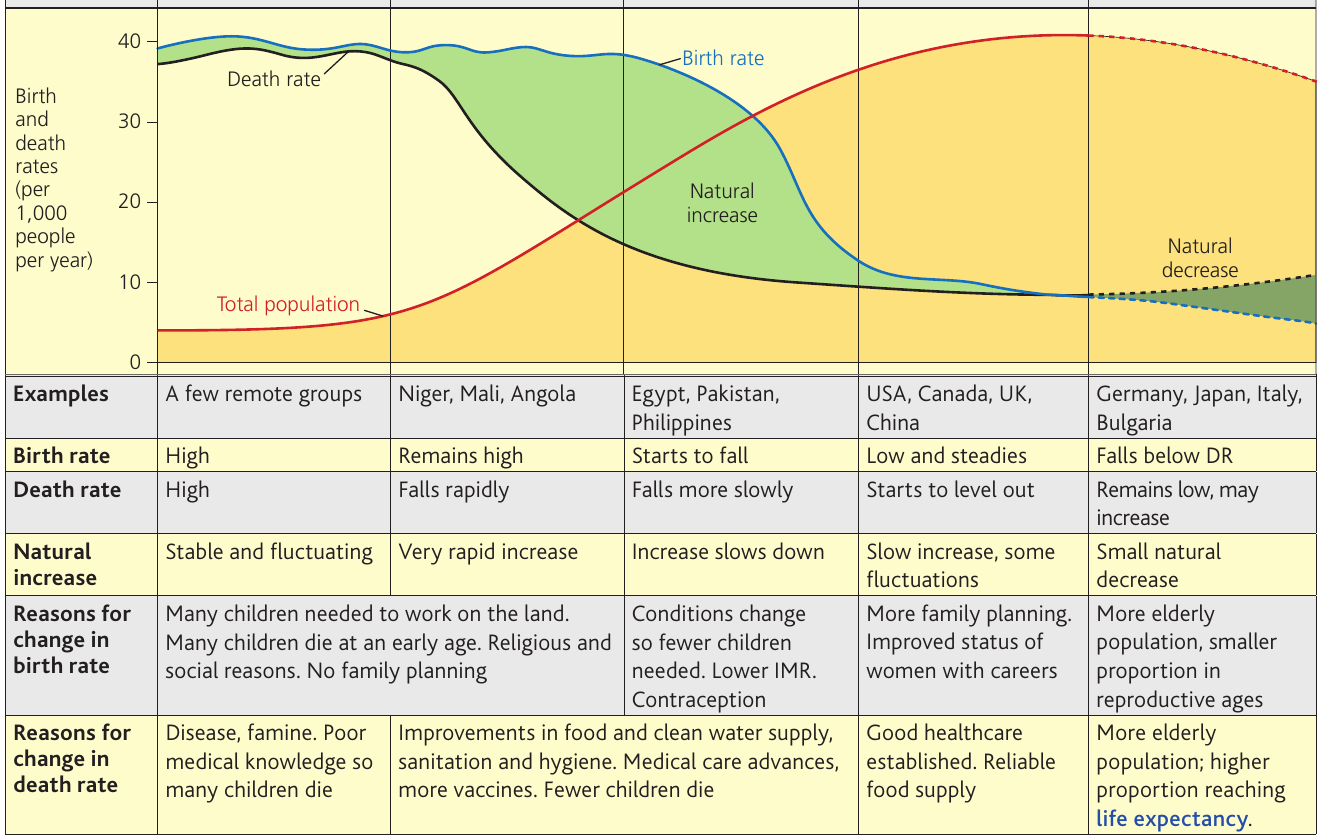
The demographic transition model consists of five distinct stages:
Stage 1: High stationary (high fluctuating)
- Both birth rates and death rates are high (around 35-40 per 1,000 people per year)
- High death rates result from disease, famine and poor medical knowledge, leading to many children dying young
- High birth rates occur because many children are needed to work on the land, and religious and social reasons discourage family planning
- Natural increase is stable but fluctuating
- Total population remains relatively low
- Examples: A few remote groups remain at this stage
Stage 2: Early expanding
- Birth rates remain high (around 40 per 1,000)
- Death rates fall rapidly (dropping towards 15 per 1,000)
- This creates very rapid natural increase
- Death rates decline due to improvements in food supply, clean water, sanitation and hygiene, medical care advances, more vaccines and fewer children dying
- Total population begins to grow significantly
- Examples: Niger, Mali, Angola
Stage 3: Late expanding
- Birth rates start to fall (declining from 35 towards 15 per 1,000)
- Death rates continue to fall more slowly (reaching around 10 per 1,000)
- Natural increase slows down compared to Stage 2
- Birth rates decline as conditions improve: fewer children are needed for work, contraception becomes available, infant mortality rates (IMR) fall
- Examples: Egypt, Pakistan, Philippines
Stage 4: Low stationary (low fluctuating)
- Both birth rates and death rates are low (around 10-15 per 1,000)
- Birth rates remain low and steady
- Death rates start to level out or slightly increase as the population ages
- Natural increase is slow, with some fluctuations
- More family planning is practised, women have improved status and pursue careers
- Good healthcare is established with reliable food supplies
- Examples: USA, Canada, UK, China
Stage 5: Decline
- Birth rates fall below death rates (birth rate around 8-10, death rate around 10-12 per 1,000)
- This creates natural decrease - the population declines
- The elderly population forms a larger proportion, whilst there is a smaller proportion of people in reproductive ages
- Higher proportions of the population are reaching old age, increasing life expectancy
- Examples: Germany, Japan, Italy, Bulgaria
The DTM applied to different countries
The rate of total population growth is most rapid when natural increase is greatest - this occurs during Stage 2 and the early part of Stage 3. During the latter part of Stage 3 and Stage 4, growth slows as there is less difference between birth and death rates, resulting in smaller natural increase. In recent years, Stage 5 has been added to account for countries experiencing declining population numbers.
Countries at various levels of economic development
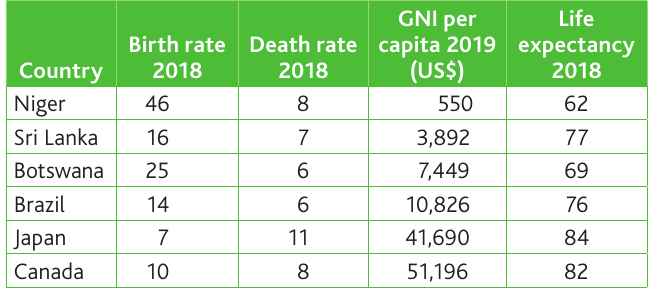
The table above shows six countries ranked by their level of economic development, measured by gross national income (GNI) per capita. The data reveals whether there is a relationship between economic development and demographic characteristics:
- Lower-income countries (like Niger with GNI of $550) tend to have higher birth rates (46 per 1,000) and lower life expectancies (62 years)
- Middle-income countries (like Brazil with GNI of $10,826) show intermediate values with birth rates around 14 and life expectancy of 76 years
- Higher-income countries (like Canada with GNI of $51,196) have lower birth rates (10 per 1,000) but higher life expectancies (82 years)
This demonstrates that as countries develop economically, they generally progress through the demographic transition, experiencing falling birth rates and increasing life expectancy.
Case studies: Niger and Canada
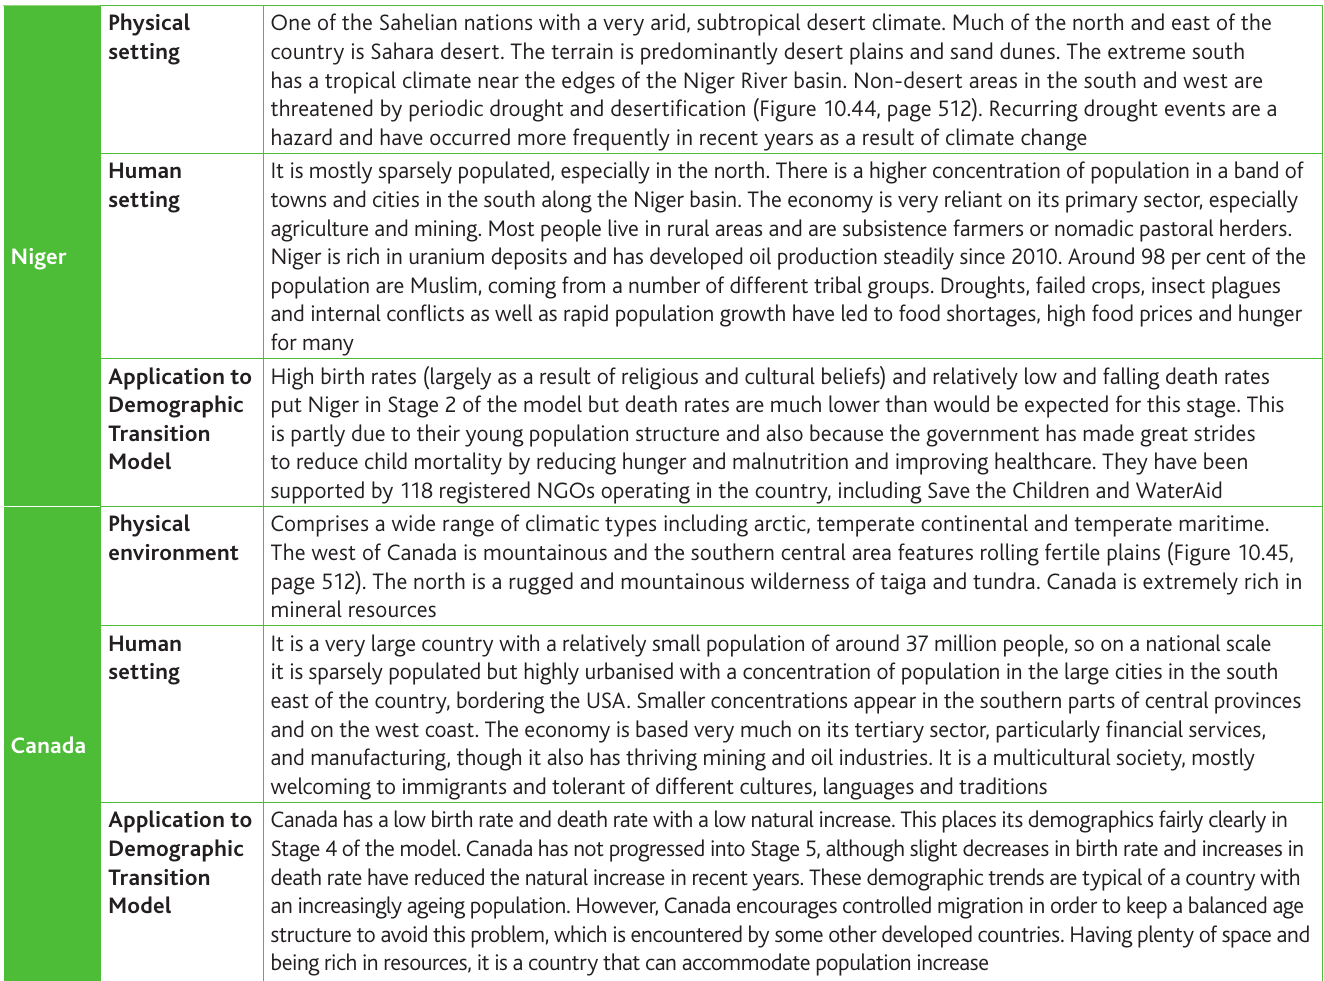
Comparing Niger and Canada illustrates how both physical conditions and human factors influence demographic transition:
Niger (Stage 2 of DTM)
Physical environment:
- One of the Sahelian nations with a very arid, subtropical desert climate
- Much of the north and east comprises Sahara desert terrain with predominantly desert plains and sand dunes
- The extreme south has a tropical climate near the Niger River basin
- Non-desert areas in the south and west are threatened by periodic drought and desertification
- Recurring drought events have become more frequent due to climate change impacts
Human characteristics:
- Sparsely populated, especially in the north, with higher population concentration along the Niger basin in the south
- Economy relies heavily on primary sectors, particularly agriculture and mining
- Most people live in rural areas as subsistence farmers or nomadic pastoral herders
- Rich in uranium deposits and has developed oil production steadily since 2010
- Around 98% of the population is Muslim, coming from different tribal groups
- Droughts, failed crops, insect plagues and internal conflicts have contributed to rapid population growth that has led to food insecurity and hunger
DTM application:
- High birth rates (largely due to religious and cultural beliefs) combined with relatively low and falling death rates place Niger in Stage 2
- Death rates are lower than would be expected for this stage, partly due to the young population structure
- The government has made significant strides to reduce child mortality by reducing hunger and malnutrition, improving healthcare
- Over 118 registered NGOs operate in the country, including Save the Children and WaterAid
Canada (Stage 4 of DTM)
Physical environment:
- Wide range of climatic types including arctic, subarctic and temperate continental
- The west features mountainous terrain whilst the southern central area has rolling fertile plains
- The north comprises rugged and mountainous wilderness of taiga and tundra
- Extremely rich in mineral resources
Human characteristics:
- Very large country with a relatively small population of around 37 million people
- Sparsely populated on a national scale but highly urbanised, with concentration of population in large cities in the south-east bordering the USA
- Smaller concentrations appear in southern parts of central provinces and on the west coast
- Economy is based heavily on the tertiary sector, particularly financial services and manufacturing, though also has thriving primary industries
- Multicultural society, mostly welcoming to immigrants and tolerant of different cultures, languages and traditions
DTM application:
- Low birth rate and death rate with low natural increase places Canada firmly in Stage 4
- Has not progressed into Stage 5, although slight decreases in birth rate and increases in death rate have reduced natural increase in recent years
- These demographic trends are typical of a country with an increasingly ageing population
- Canada encourages controlled migration to maintain a balanced age structure and avoid problems encountered by other developed countries
- Having plenty of space and being rich in resources, it can accommodate population increase
Evaluation of the DTM
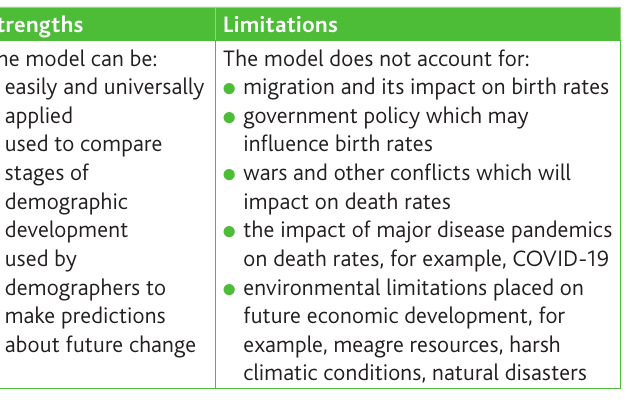
Strengths of the model:
- Universal applicability: The model can be applied to all countries, providing a common framework for comparison
- Comparative tool: It can be used to compare stages of demographic development between different countries
- Predictive value: Demographers can use the model to make predictions about future population changes
Limitations of the model:
- Migration ignored: The model does not account for migration and its impact on birth rates, which can be significant in many countries
- Government policy excluded: It fails to consider how government policies may influence birth rates (such as China's former one-child policy or pro-natalist policies in some European countries)
- Wars and conflicts: The model does not account for wars and other conflicts which can dramatically impact death rates
- Disease pandemics: It doesn't consider the impact of major disease pandemics on death rates, such as COVID-19 or HIV/AIDS epidemics
- Environmental constraints: The model overlooks environmental limitations placed on future economic development, such as meagre resources, harsh climatic conditions or natural disasters
The demographic transition model is not perfect but still provides a useful framework for comparing real data. Its limitations can help explain anomalies that occur between a nation's actual transition and what the model predicts. Countries do not all progress smoothly through the model - sometimes the transition falters or even reverses.
The model might have greater validity if social, cultural and political factors were given equal importance to economic development. However, these factors are less predictable and may render the model unnecessarily complex.
Population structure - age and sex composition
Understanding population structure
Population structure: A term used to describe the age distribution and sex composition of a population.
Population structure is usually examined at a national scale, by country, but it can be analysed at many different scales - from local communities to entire continents.
Population pyramids
Population pyramid: A visual representation showing the age distribution and gender composition of a population at a specific point in time.
Population structure is typically depicted through the construction of a population pyramid. A population pyramid represents a snapshot at any given moment, but population structure constantly changes as each age group moves up the pyramid over time.
What population pyramids show
Population pyramids provide valuable insights into past trends and current conditions:
- Show past changes in population patterns
- Predict short-term and long-term future changes in population
- Show the effects of wars, diseases and famine on population structure
- Indicate life expectancy in a country
- Give an idea of the stage of demographic transition a country has reached
- Show effects of migration on a population structure, including the age and gender of migrants
Example: UK population pyramid 2018
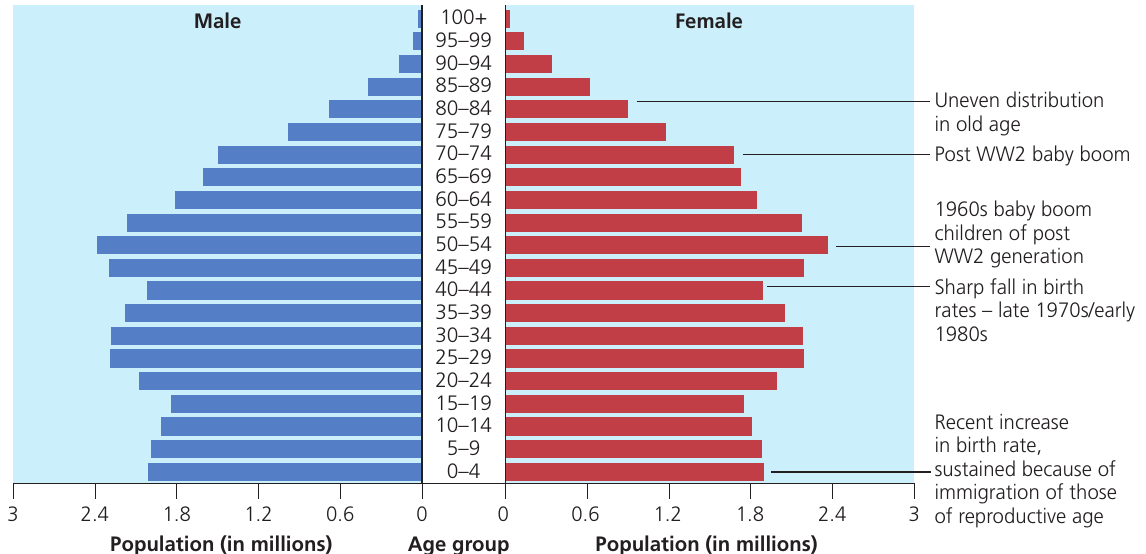
The UK's 2018 population pyramid reveals several key features:
- Uneven distribution in old age: More women than men survive to older ages, creating wider bars on the female side at the top
- Post-WW2 baby boom: Evident in the 70-74 age group, showing increased births after the Second World War ended
- 1960s baby boom: The 50-54 age group shows the children of the post-war generation, sometimes called the "baby boom generation"
- WW2 generation: The 75-79 age group shows those born during the war years
- Sharp decline in birth rates: The 35-44 age groups show the impact of falling birth rates during the late 1970s and early 1980s
- Recent increase in birth rates: The youngest age groups show a rise in births, sustained because of immigration of people of reproductive age
Dependency and its implications
For analytical purposes, population structures and their representative pyramids are divided into three broad categories based on economic productivity:
- Ages 0-14: Known as the young dependent population
- Ages 15-64: Known as the economically active population
- Ages 65 plus: Known as the elderly dependent population
The working population
The economically active age group tends to be the working population - those who earn an income and pay taxes. The two dependent groups (young and elderly) are known as the non-economically active population. They depend on the economically active to maintain their quality of life. Young dependants rely on their parents to support them, whilst the elderly rely on pensions and/or family support, depending on the development of social services where they live.
The dependency ratio
Dependency ratio: A measure of the level of dependency in a population, expressed as a percentage.
The formula for calculating the dependency ratio is:
Worked Example: Calculating the Dependency Ratio for the UK (2019)
Given data:
- Ages 0-14: 11.96 million (17.8% of population)
- Ages 15-65: 42.87 million (63.8% of population)
- Ages 65+: 12.37 million (18.4% of population)
Step 1: Identify the formula
Step 2: Substitute the values
Step 3: Calculate
Interpretation: This means that for every 100 people of working age, there are approximately 57 people dependent on their earnings.
Application of population structure to natural change
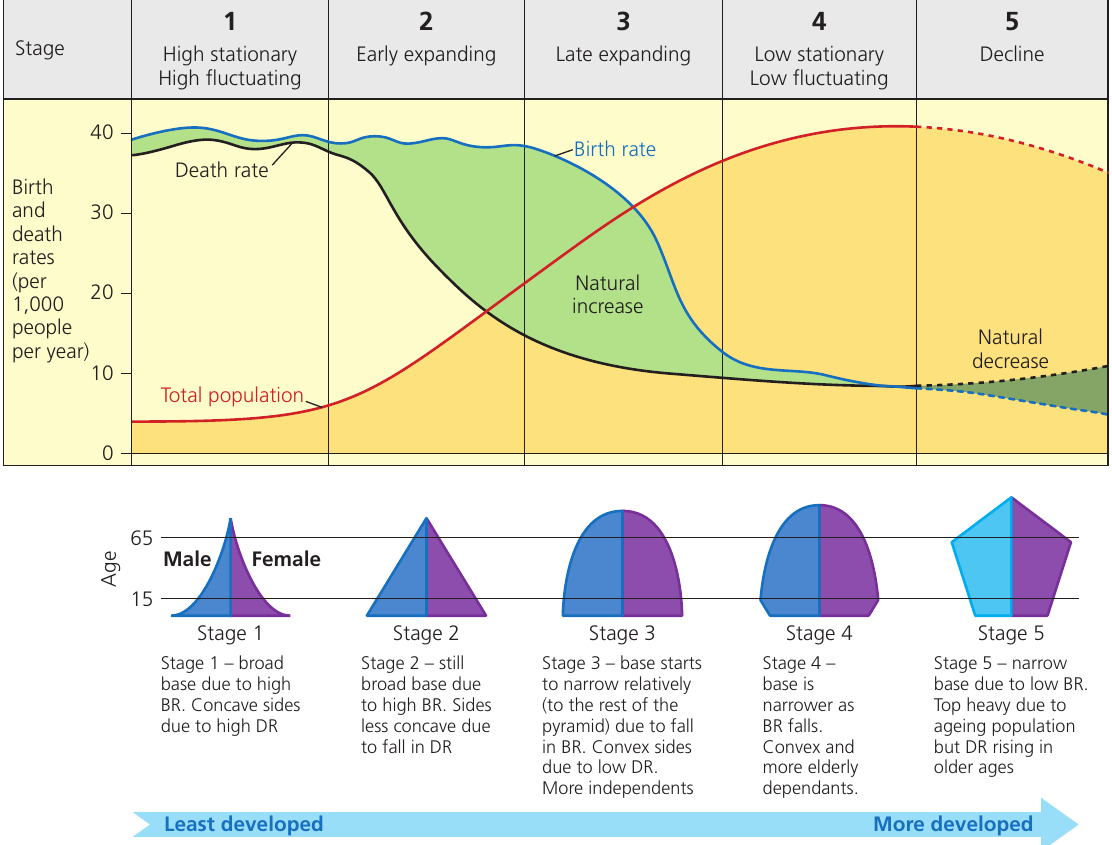
The shape of the population pyramid evolves based on changes in fertility and mortality rates. The demographic transition model provides a predicted sequence of change in birth rates and death rates over time. These two concepts can be linked to create a 'definitive' shape of population pyramid for each stage of the model:
Stage 1 (High stationary):
- Broad base due to high birth rate
- Concave sides due to high death rate
- Population pyramid shape
Stage 2 (Early expanding):
- Still broad base due to continuing high birth rate
- Sides less concave due to falling death rate
- Classic pyramid shape maintained
Stage 3 (Late expanding):
- Base starts to narrow relatively compared to the rest of the pyramid due to falling birth rate
- Most of pyramid has parallel or slightly concave sides due to low death rate
- More moderate dependants
Stage 4 (Low stationary):
- Narrower base as birth rate falls further
- More elderly dependants appear at the top
- Beehive or pillar shape
Stage 5 (Decline):
- Narrow base due to very low birth rate
- Top becomes heavy due to ageing population
- Birth rate rising in older ages
- Inverted or top-heavy shape
The model determines what stage of demographic development a country has reached, so we can suggest an associated population structure for countries at each stage of development.
Implications of different population structures
These contrasting population structures have different implications for the use of resources and services, and for the economic potential of countries at different stages of development.
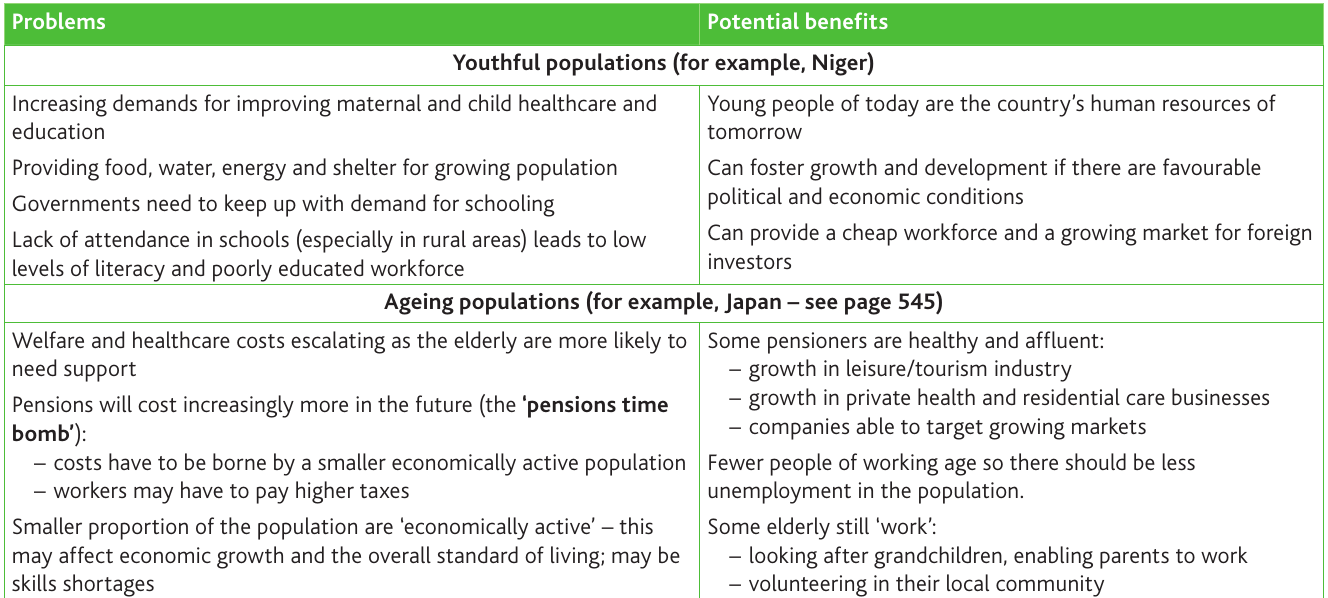
The composition of dependency varies between more and less developed economies. In richer countries, a greater proportion of the dependency comprises the elderly population, whereas in less developed countries the higher overall dependency is largely from a youthful population. Both types of structure create problems resulting from dependency, but they also offer potential benefits.
Problems and benefits of youthful populations (e.g., Niger)
Problems:
- Increasing demands for improving maternal and child healthcare and education - young people of today are the country's human resources of tomorrow
- Providing food, water, energy and shelter for a growing population
- Governments need to keep up with demand for schooling
- Lack of attendance in schools (especially in rural areas) leads to low literacy levels and poorly educated workforce
Potential benefits:
- Can foster growth and development if there are favourable political and economic conditions
- Can provide a cheap workforce and a growing market for foreign investors
Problems and benefits of ageing populations (e.g., Japan)
Problems:
- Welfare and healthcare costs escalate as the elderly are more likely to need support
- Pensions will cost increasingly more in the future - the 'pensions time bomb':
- Costs have to be borne by a smaller economically active population
- Workers may have to pay higher taxes
- Smaller proportion of the population are 'economically active' - this may affect economic growth and the overall standard of living; there may be skills shortages
Potential benefits:
- Some pensioners are healthy and affluent:
- Growth in leisure/tourism industry
- Growth in private health and residential care businesses
- Companies can target growing markets
- Fewer people of working age means there should be less unemployment in the population
- Some elderly still 'work':
- Looking after grandchildren, enabling parents to work
- Volunteering in their local community
The demographic dividend
Demographic dividend: A period when the population structure of a country means there is low dependency.
The demographic dividend refers to a time when a country's population structure results in a relatively small dependent population compared to the working-age population. This typically occurs during the transition from Stage 2 to Stage 3 of the DTM, when birth rates have started to fall but the population structure still has relatively few elderly dependants.
During this period, a country can experience:
- A larger proportion of the population in economically productive ages
- Reduced burden on education and childcare services
- Increased potential for economic growth and development
- Opportunity to invest in infrastructure and future development
However, this advantage is temporary. As the population continues to age and moves towards Stage 4, the demographic dividend ends and countries must prepare for the challenges of an ageing population.
Remember!
Key Points to Remember:
-
The demographic transition model (DTM) shows how countries transition through five stages from high birth and death rates to low birth and death rates, with Stage 5 showing population decline.
-
The rate of population growth is fastest in Stage 2 when death rates fall rapidly but birth rates remain high, creating rapid natural increase.
-
Population pyramids are powerful tools for understanding population structure - they show past changes, predict future trends, indicate life expectancy and reveal the effects of events like wars or migration.
-
The dependency ratio measures the burden placed on the working-age population by young and elderly dependants - different countries face different dependency challenges (youthful vs ageing populations).
-
The demographic dividend represents a window of opportunity when a country has low dependency and a large working-age population, potentially boosting economic development if conditions are favourable.