Population Change (AQA A-Level Geography): Revision Notes
Population change
Understanding population change
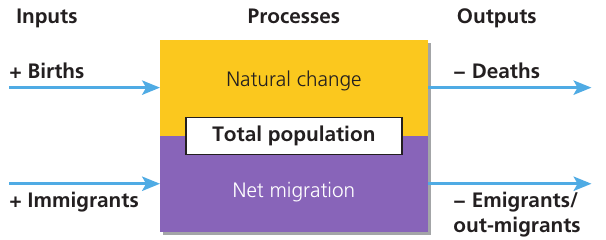
Population size changes over time through two main processes. These processes work together to determine whether a population grows, shrinks, or remains stable.
The first process is natural change, which refers to the balance between births and deaths within a population. The second is migration change, which involves people moving into or out of an area. Together, these components create the total population change for any given region.
Understanding both natural change and migration change is essential for analyzing population dynamics, as they often interact in complex ways. For example, migration can affect the age structure of a population, which in turn influences natural change rates.
Natural change
Natural change occurs when there is a difference between the number of births and deaths in a population. When more babies are born than people die, this creates a natural increase in population size. Conversely, when deaths outnumber births, the result is a natural decrease.
This change is measured using two key indicators. The crude birth rate tells us how many babies are born per 1,000 people each year, whilst the crude death rate measures how many people die per 1,000 population annually. The gap between these two rates determines whether a population will grow or decline naturally.
Crude birth rate – The number of live births per 1,000 of a population per year, also known as 'birth rate'.
Crude death rate – The number of deaths per 1,000 of a population per year, also known as 'death rate'.
Migration change
Migration involves the movement of people across borders or between regions. Those entering an area are called immigrants, whilst those leaving are termed emigrants. The difference between these two groups creates the net migration change.
When more people move into an area than leave it, this produces positive net migration and increases the population. When more people leave than arrive, negative net migration occurs and the population decreases. Migration is particularly significant because migrants are often of reproductive age, which can affect birth rates in both the origin and destination areas.
Demographic Impact of Migration
When younger migrants enter a country, they increase the proportion of people who can have children. This raises the potential for births and can lower the death rate because there are fewer elderly people as a proportion of the total population. Such demographic shifts mean that migration influences not only the size of a population but also its natural change rate.
Net migration change – The difference between the total number or average rate of immigrants and emigrants in an area or country over a given period of time. More immigrants than emigrants gives a positive net migration; more emigrants than immigrants gives negative net migration.
Key vital rates
Understanding how populations change requires examining specific demographic indicators. These rates provide essential information about population dynamics and help geographers predict future trends.
Global variations in birth and death rates
Birth rates and death rates vary considerably across the world. Some countries experience high birth rates and rapidly growing populations, whilst others face declining births and ageing societies. This variation reflects differences in economic development, healthcare provision, and cultural practices.
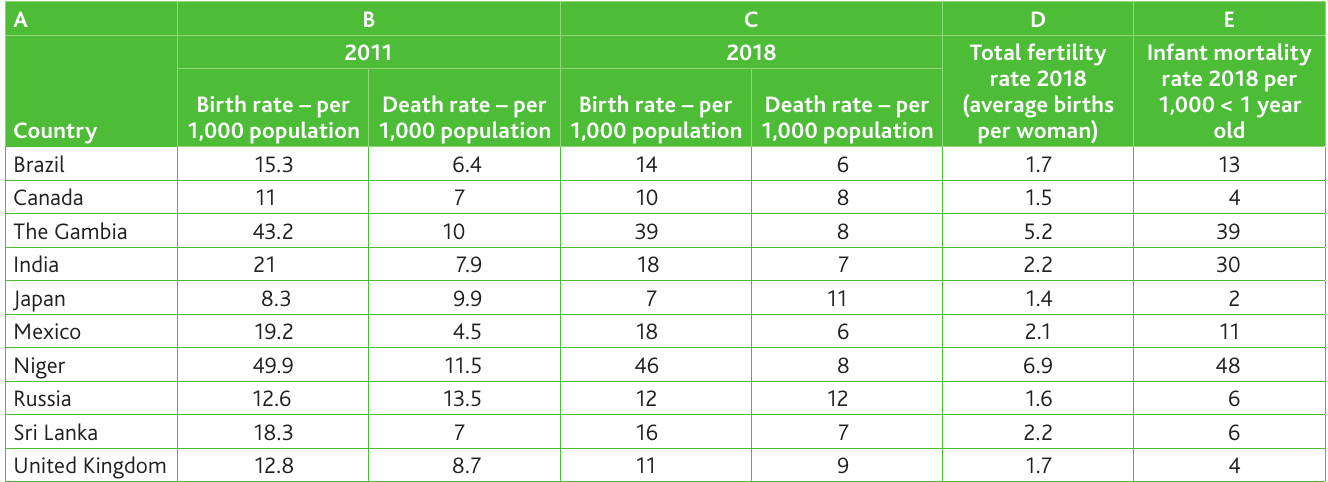
The data shows substantial differences between countries. Most nations have achieved a natural increase, meaning births exceed deaths. However, some developed countries are beginning to experience natural decrease as their populations age and fertility rates fall.
Country examples
Worked Example: Niger's Population Dynamics
Niger demonstrates one extreme of population dynamics. In 2018, it had a birth rate of 46 per 1,000 people, though this had fallen from 49.9 per 1,000 in 2011. Despite this decline, Niger maintains the highest birth rate in the comparison.
This pattern results from the country's youthful population structure and limited healthcare improvements, though many non-governmental organisations have worked to support public health systems and provide better welfare and medical care.
Calculating natural increase: The difference between Niger's birth and death rates in 2018 was 38 per 1,000, representing the highest natural increase shown in the data.
Worked Example: Japan's Population Challenge
Japan presents a contrasting situation. It is the only country in the comparison experiencing natural decrease, with four fewer people per 1,000 in 2018.
This demographic challenge stems from:
- Declining birth rates combined with rising death rates
- Both linked to Japan's ageing population structure
- As the proportion of elderly people increases, deaths naturally rise
- The number of potential parents decreases simultaneously
Growth rates and their calculation
From natural change data, demographers can determine a population's growth rate. By multiplying the natural change figure by 100, we obtain a percentage.
Calculating Growth Rate: Niger
Step 1: Start with natural increase Natural increase = 38 per 1,000
Step 2: Convert to percentage Growth rate = 38 × 100 = 3.8%
Step 3: Apply to population projections With a 2019 population of approximately 23.3 million, this growth rate suggests the population could double by 2045 if it continues at this pace.
Total fertility rate
The total fertility rate provides a more accurate picture of reproductive patterns than the crude birth rate. Rather than measuring all births across the entire population, it calculates the average number of children each woman would have if all women lived through their childbearing years (typically considered to be between ages 15 and 44).
This measure proves more useful for predicting future population change because it focuses specifically on those capable of giving birth. It accounts for the age structure of the population rather than simply dividing all births by the total population number.
Total fertility rate – The average number of children born per woman in an area or country if all women lived to the end of their childbearing years. It is considered to be a more direct and accurate measure of fertility than birth rate as it refers to the average number of births per woman in a given population.
Replacement fertility rate
The replacement fertility rate represents the number of children each woman must have to maintain current population levels without growth or decline. This figure stands at 2.1 children per woman. The extra 0.1 accounts for the slightly higher number of male births and for children who die before reaching reproductive age.
Currently, the global average replacement fertility rate sits at 2.3, higher than the theoretical 2.1. This difference exists because some populations experience higher child mortality rates, requiring more births to ensure population replacement.
Global Fertility Patterns
Different countries show vastly different fertility patterns:
- Richer nations typically have rates below 2.1, indicating long-term population decline without immigration
- Countries facing high infant and child mortality, such as Sierra Leone, may have rates as high as 3.4 as families have more children to ensure some survive to adulthood
Looking at the sub-Saharan countries of Niger and The Gambia in the data, we see the highest fertility rates. If these rates continue, their populations will expand rapidly as each generation becomes larger than the previous one. Other countries show lower than replacement fertility, suggesting future population shrinkage. However, populations can still increase even with below-replacement fertility if they contain more than just the youngest two generations, with many people living longer. This situation currently applies to the UK and similar developed nations.
Replacement fertility rate – The number of children each woman needs to have to maintain current population levels or give zero population growth by each subsequent generation. It is a measured total fertility rate (see below). If fertility is above the replacement rate, population will grow and if it is below, population will decline.
Infant mortality rate
The infant mortality rate measures how many children die before reaching their first birthday per 1,000 live births each year. This statistic serves as a particularly important indicator for several reasons.
Firstly, it is age specific, relating to one vulnerable group that society should prioritise protecting. Secondly, it provides an indication of healthcare levels available in a population, particularly regarding maternity and post-natal care, as well as the prevalence of diseases that particularly affect infants. Thirdly, it offers an indication of wealth, as higher income countries can afford better healthcare, medicines, healthy diets and clean water that help keep infants alive.
Impact on Family Planning
Infant mortality has a direct impact on fertility rates. In areas experiencing high infant and child mortality, families tend to have more children to ensure some survive into adulthood and can eventually care for their elderly parents.
Infant mortality rate – The number of children who die before their first birthday per 1,000 live births per year.
Factors affecting fertility
Fertility rates vary considerably globally due to numerous interconnected influences. These can be categorised into social, economic, and political factors, though in reality they overlap and interact with one another.
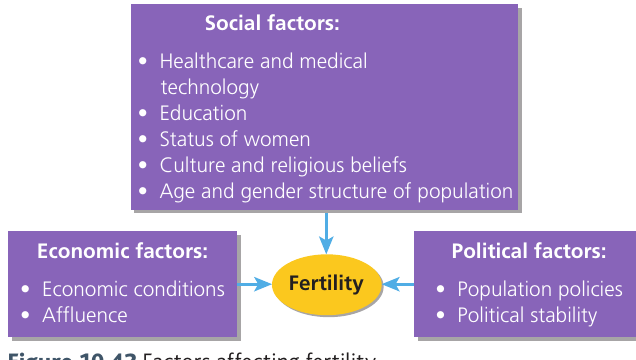
Social factors
Healthcare and medical technology play a crucial role in fertility decisions. When healthcare improves and medical technology advances, infant mortality typically falls. Parents no longer need to have many children to ensure some survive, leading to smaller family sizes. Access to family planning services and contraception also enables couples to control their fertility more effectively.
Education influences fertility in multiple ways. As populations become more educated, particularly women, they tend to have fewer children. Education provides knowledge about contraception and family planning. It also creates career opportunities that may lead people to delay childbearing or limit family size.
The status of women significantly affects fertility rates. In societies where women face discrimination and limited opportunities for education, they often leave their own families to marry and care for in-laws. The degree of equal opportunities in education and careers afforded to women directly influences how many children each mother will have during her lifetime.
Culture and religious beliefs shape attitudes towards family size and contraception. Some religions and cultural traditions encourage large families, whilst others have adapted to promote smaller family units.
The age and gender structure of the population itself influences fertility. Populations with higher proportions of people in their reproductive years (15-44) will naturally have more births, even if individual women have fewer children on average.
Economic factors
Economic conditions strongly influence family size decisions. In more economically developed societies, parents tend to have fewer children. Having children is viewed as expensive, especially when contraception is readily available. Career-focused parents may prioritise work over large families to maintain their living standards.
Conversely, larger families were once the norm in the UK when society was less economically developed. Family planning increasingly reflects economic decisions that enable both parents to work and maintain their personal living standards.
Affluence generally correlates with lower fertility. Wealthier nations and individuals tend to have smaller families, as the economic need for many children (such as for agricultural labour) has diminished, and the costs of raising children have increased.
Political factors
Population policies can directly influence fertility rates. Governments may implement strategies to either encourage or discourage births depending on their demographic challenges.
Political stability affects fertility decisions. In stable political environments, people feel more secure about having children and planning for the future. Instability may either discourage childbearing or, in some cases, lead to higher fertility if social systems break down.
Cultural controls on fertility
Beyond the broader social factors, specific cultural practices and beliefs have profound effects on family size decisions.
Religion
Religious doctrine significantly influences attitudes towards contraception and family planning. Roman Catholicism and Islam traditionally forbid artificial contraception and abortion as methods of population control. Most countries where Catholicism dominates demonstrate relatively low fertility rates with only slow population growth, and in some cases population decline. This suggests that other cultural values, such as equal opportunities for women or materialism, may override religious doctrine in these contexts.
Countries with Muslim majorities often show some of the highest fertility rates and fastest population growth, even though certain types of artificial contraception are permissible in Islamic teachings. In these cases, it appears that economic factors, other cultural traditions, or even environmental factors drive higher fertility rates rather than purely religious requirements.
Gender preference
Some societies maintain a distinct preference for male children, particularly in rural areas of developing countries. Males are expected to work the family land and provide care for parents in old age. This cultural norm persists in parts of Pakistan, India, and sub-Saharan African countries such as Niger and Mali. The obvious consequence is higher fertility rates as parents continue having children until they have one or two sons.
Status of women
Women face discrimination in many cultures, often receiving limited or no education. Social expectations dictate that married women should leave their own families to live with and care for in-laws. The degree of equal opportunities in education and careers afforded to females directly influences the number of children each mother will have throughout her lifetime. Greater equality typically results in lower fertility as women pursue education and careers alongside or instead of early motherhood.
Child marriage
In the least developed countries, particularly in sub-Saharan Africa, approximately 40 per cent of girls marry before reaching age 18, with 12 per cent marrying before age 15. UNICEF reports that more than 50 per cent of girls in six sub-Saharan African countries and Bangladesh were married before reaching 18 years old.
Many African countries have established legal minimum marriageable ages between 16 and 18. In certain countries, such as Niger, the minimum age for girls is 15 with parental or judicial consent. These practices clearly impact the number of children a mother will have, as well as affecting the mother's health and future opportunities.
Effects of population policies
Government interventions can substantially shape fertility patterns. China's enforced one-child policy has left a lasting legacy. Parents now choose to have one child as the social norm, even after the policy was discontinued in 2015. From 2016, the government encouraged two-child families, but after a slight initial increase, birth numbers decreased again. This suggests that fertility rates will likely remain very low in China.
Economic Pressures in Modern China
Young people face:
- High house prices
- Labour market pressures
- Significant expense of raising and educating children
For economic reasons as much as social norms, most people intend to have only one or two children, averaging below the replacement fertility rate. With an ageing population, China may eventually need to consider introducing pro-natal (birth-encouraging) policies in the future.
Case Study: India's Fertility Transition
Even in countries with less coercive population policies, government strategies advocating population control can influence culture and societal norms. Some Indian states have adopted two-child policies by introducing penalties and disincentives for families with more than two children.
Results:
- Average Indian fertility rates have fallen from 3.2 to 2.2 over the past 20 years
- Fertility rates in 23 Indian states now fall below replacement fertility
- Kerala, a state in south India, initiated a culture of smaller families as the social norm by introducing compulsory female secondary education in the 1980s
- It now has the lowest fertility rate of 1.2
Models of natural population change
A 'model' provides a simplified structure representing real-world characteristics, processes, and relationships. Demographers have developed various conceptual frameworks for understanding population change and its impacts. The demographic transition model examines how population is thought to grow over time and links this growth to broader societal development.
Demographic transition model
The demographic transition model (DTM) was developed by American demographer Warren Thompson in 1929 and has been updated to record observed changes in birth rates and death rates in industrialised countries since the Industrial Revolution began. It traces a change from high birth rates and high death rates to low birth rates and low death rates as a country develops from a pre-industrial economy to an industrialised economic system.
The rate of change varies from country to country, and countries will be located at different stages along the transition at any given time. Looking back to epidemiological transition theory helps explain the different stages and changes in the DTM as it accounts for shifting patterns of disease.
The updated model contains five stages, each identified by what is happening to birth rates, death rates, and total population size.
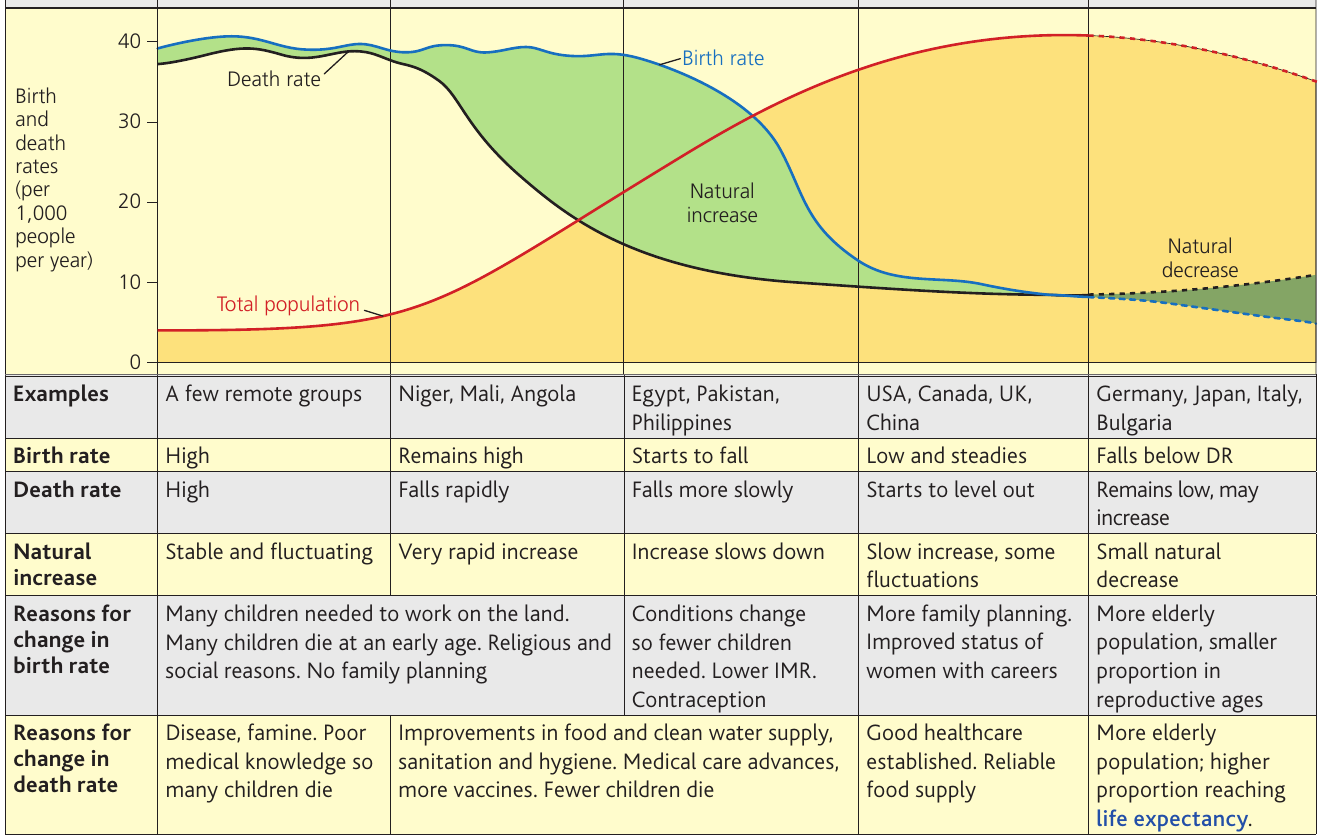
Stage 1: High stationary
This stage is characterised by both high birth rates and high death rates, which fluctuate considerably. The population remains relatively stable with little overall growth, though numbers may vary due to famine, disease, or other crises.
Characteristics of Stage 1:
Birth rates remain high because:
- Many children are needed to work on the land
- Many children die at an early age due to disease and poor living conditions
- Religious and social reasons encourage large families
- No family planning methods are available to limit births
Death rates stay high because of:
- Disease and famine
- Poor medical knowledge
- Many children dying young
Very few countries or populations currently exist in this stage. A few remote groups might still experience these conditions, but most of the world has progressed beyond Stage 1.
Stage 2: Early expanding
In this stage, birth rates remain high whilst death rates begin to fall rapidly. This creates a very rapid natural increase as the gap between births and deaths widens significantly.
Characteristics of Stage 2:
Birth rates continue at high levels for the same reasons as Stage 1:
- Children are needed for labour
- Many still die young
- Contraception remains largely unavailable
Death rates fall because of:
- Improvements in food supply and clean water provision
- Better sanitation and hygiene practices
- Advances in medical care
- More vaccines becoming available
- Fewer children dying in infancy
Countries such as Niger, Mali, and Angola currently demonstrate Stage 2 characteristics. These nations have seen healthcare improvements but maintain high fertility due to continuing cultural and economic factors.
Stage 3: Late expanding
Birth rates begin to fall in this stage whilst death rates continue to fall more slowly. The natural increase starts to slow down as the gap between births and deaths narrows.
Characteristics of Stage 3:
Birth rates start to decline as conditions change:
- Fewer babies are needed as infant mortality reduces due to improved healthcare
- Lower infant mortality rate (IMR) means parents can be confident their children will survive
- Contraception becomes more widely available and socially acceptable
Death rates fall more slowly as:
- Most major healthcare improvements have already occurred
- Further reductions require tackling more complex health challenges
Countries such as Egypt, Pakistan, and the Philippines currently exemplify Stage 3. These nations have made significant development progress but are still transitioning towards lower fertility.
Stage 4: Low stationary
Both birth rates and death rates are low in this stage, with some fluctuations. The natural increase is slow, and population growth has stabilised at a low level.
Characteristics of Stage 4:
Birth rates remain low and steady because of:
- More family planning opportunities
- Women have improved status, with access to education and careers
- Improved living standards mean parents choose smaller families
Death rates start to level out:
- Good healthcare is established and reliable food supplies are maintained
- However, death rates may begin to slowly increase as the population ages
- A higher proportion reaches elderly age groups
Countries such as the USA, Canada, UK, and China currently occupy Stage 4. These nations have completed the demographic transition to low birth and death rates, though they face the challenges of ageing populations.
Stage 5: Decline
This recently identified stage shows birth rates falling below death rates, creating a natural decrease. The total population begins to shrink.
Characteristics of Stage 5:
Birth rates fall below the death rate as:
- Populations age and fewer people are in their reproductive years
- Those who are in reproductive years often choose to have very small families or remain childless
- Career priorities, housing costs, and lifestyle choices contribute to very low fertility
Death rates remain low but may increase slightly as:
- The proportion of elderly people grows
- More elderly population means a higher proportion reaching the end of their life expectancy
Countries such as Germany, Japan, Italy, and Bulgaria currently demonstrate Stage 5 characteristics. These nations face significant demographic challenges including population decline, smaller working-age populations, and higher proportions of elderly people requiring care and pensions.
Remember!
Key Points to Remember:
-
Population change has two components: natural change (births minus deaths) and net migration (immigrants minus emigrants).
-
Total fertility rate is a more accurate measure than crude birth rate for predicting population trends, as it focuses on the average number of children per woman rather than total births across all age groups.
-
Fertility is influenced by multiple factors including social elements (healthcare, education, women's status), economic conditions (affluence, living standards), and political factors (population policies, stability).
-
The demographic transition model shows how countries progress through five stages from high birth and death rates to low rates and potential population decline as they develop economically.
-
Replacement fertility rate of 2.1 children per woman is needed to maintain population levels, but many developed countries now have rates below this threshold, indicating future population decline without immigration.