Sketching Polynomials (AQA A-Level Mathematics): Revision Notes
📚 Revision Notes
2.7.1 Sketching Polynomials
Sketching Quartic Graphs
Characteristics of Different Degree Polynomials
-
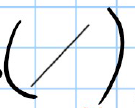
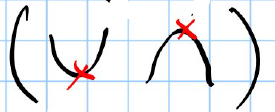
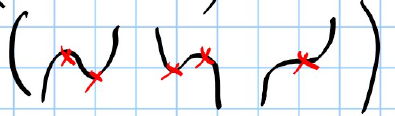
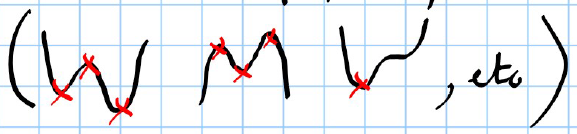
A straight line (degree 1) has no turning points.
-
A quadratic (degree 2) has 1 turning point.
-
A cubic (degree 3) has up to 2 turning points.
-
A quartic (degree 4) has up to 3 turning points.
infoNote
Example: Sketch the following quartic
- Find the roots (x-intercepts) where :
-
Set :
-
The roots are .
- Find the y-intercept (where ):
- Substitute :
- Draw the graph:
- Plot the x-intercepts .
- Plot the y-intercept .
- Draw a smooth curve passing through these points.
infoNote
Important Note
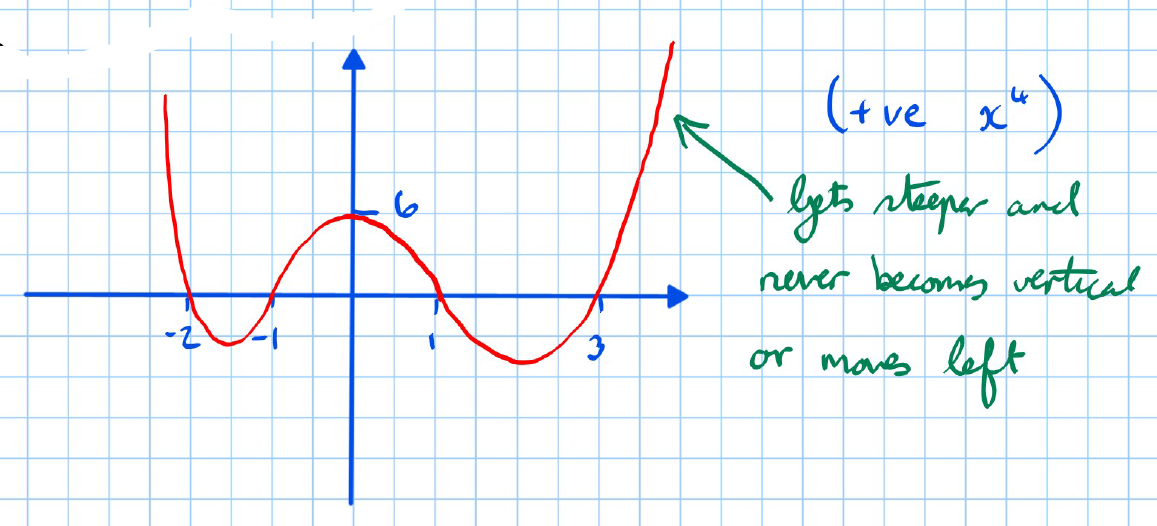
- Positive Quartic:
- Starts from the top left and ends at the top right.
- Example: .
- Negative Quartic:
- Starts from the bottom left and ends at the bottom right.
- Example: .
infoNote
Summary Steps for Sketching Quartic Graphs
- Find roots (-intercepts):
- Set and solve for .
- Find the y-intercept:
- Set and solve for .
- Determine the end behaviour:
- If the coefficient of is positive, the graph starts and ends at the top.
- If the coefficient of is negative, the graph starts and ends at the bottom.
- Sketch the graph:
- Plot the intercepts.
- Ensure the curve smoothly passes through these points and follows the correct end behaviour.
Sketching Cubic Graphs
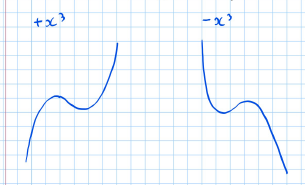
A cubic graph can take one of two shapes depending on whether the coefficient of is positive or negative.
Shapes of Cubic Graphs
- Positive coefficient:
- The graph starts from the bottom left and ends at the top right.
- Negative coefficient:
- The graph starts from the top left and ends at the bottom right.
infoNote
Example: Sketch 8. Find the roots (x-intercepts) where :
- Set
- The roots are .
- Find the y-intercept (where ):
- Substitute :
- Sketch the graph:
- Plot the x-intercepts .
- Plot the y-intercept .
- Draw a smooth curve passing through these points, starting from the bottom left (since the coefficient of is positive) and ending at the top right.
infoNote
Points to Note
- Label all intercepts clearly on the graph.
- Ensure the curve does not go back on itself and smoothly passes through the intercepts.
- For the best example:
- Clearly mark the intercepts.
- Ensure the curve has the correct shape for the given cubic equation.
Correct and Incorrect Sketches
- Correct Sketch:
- Clearly labelled intercepts.
- Smooth curve passing through all intercepts.
- Correct end behaviour based on the coefficient of .
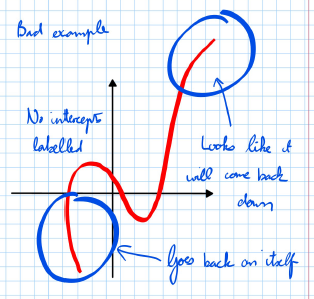
- Incorrect Sketch:
- No intercepts labelled.
- The curve going back on itself.
- The curve looking like it will come back down when it should not.
Sketching Cubic Graphs with Roots
infoNote
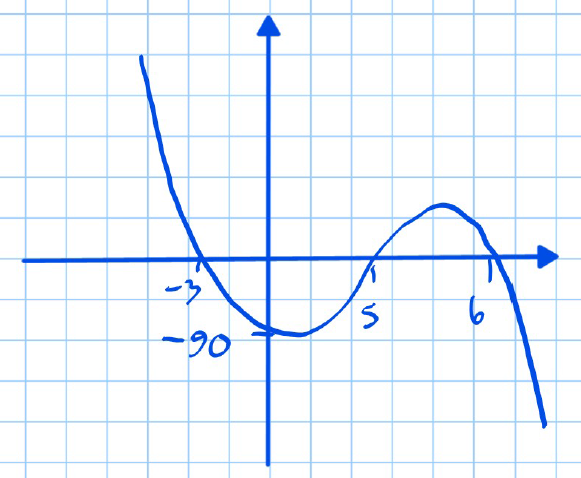
Example 1: Sketch
- Find the roots (-intercepts) where :
-
Set :
-
The roots are .
- Find the y-intercept (where ):
- Substitute
- Sketch the graph:
- Plot the -intercepts .
- Plot the y-intercept .
- Draw a smooth curve passing through these points.
infoNote
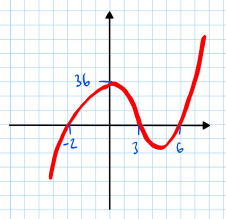
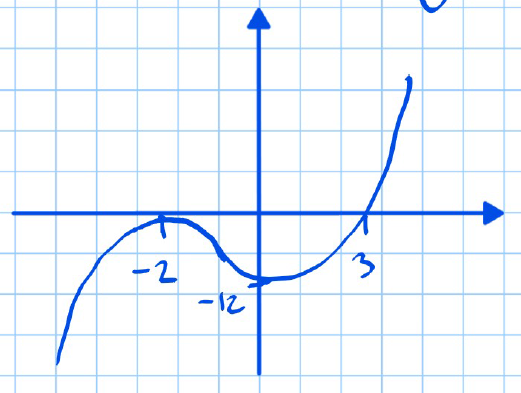
Example 2: Sketch
- Notice the double root:
- The equation has a double root at .
-
Rewrite the equation:
-
Find the roots (x-intercepts) where :
-
Set :
-
The roots are (double root), .
- Find the y-intercept (where ):
- Substitute :
- Sketch the graph:
- Plot the -intercepts .
- Plot the -intercept .
- Draw a smooth curve passing through these points, noting the double root behaviour at .
infoNote
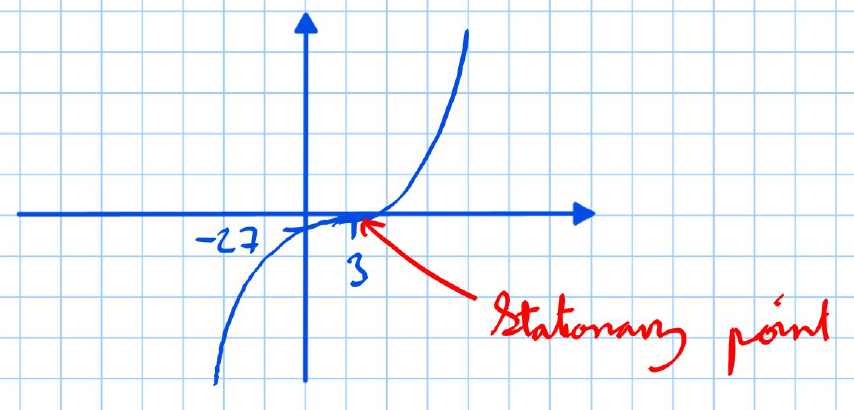
Example 3: Sketch 16. Identify the triple root:
- The equation has a triple root at .
- Find the root (-intercept) where :
-
Set :
-
The root is .
- Find the y-intercept (where ):
- Substitute :
- Sketch the graph:
- Plot the -intercept .
- Plot the y-intercept .
- Draw a smooth curve passing through these points, noting the triple root behaviour at .
infoNote
Summary
- For single roots, the curve crosses the -axis.
- For double roots, the curve touches the -axis and turns around.
- For triple roots, the curve flattens at the -axis.
Standard Graphs
The shapes of the following graphs need to be learned:
1. Graph of
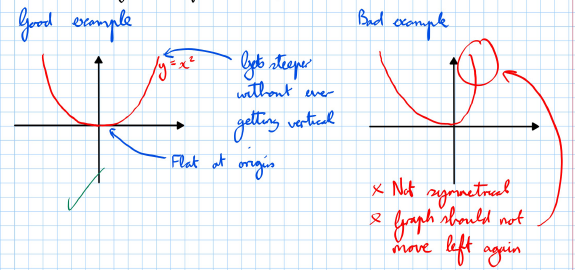
Good Example
- The graph is a parabola that opens upwards.
- It gets steeper but never becomes vertical.
- It is flat at the origin.
Bad Example
- The graph is not symmetrical.
- The graph should not move left again.
- It should be flat at the origin and smooth.
2. Graph of
Good Example
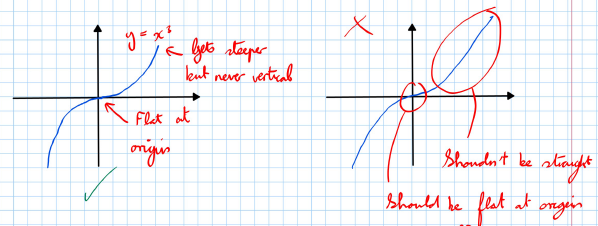
- The graph starts from the bottom left and ends at the top right.
- It gets steeper but never becomes vertical.
- It is flat at the origin.
Bad Example
- The graph is not smooth.
- It should be flat at the origin.
- The graph should not go back on itself.
3. Graph of
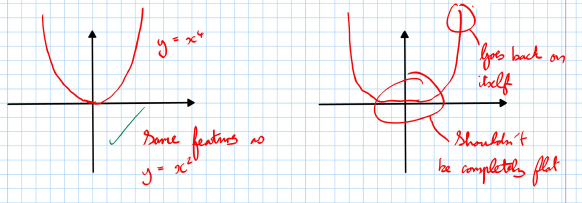
- This graph looks similar to but is steeper.
- It has the same basic shape and features.
4. Graph of
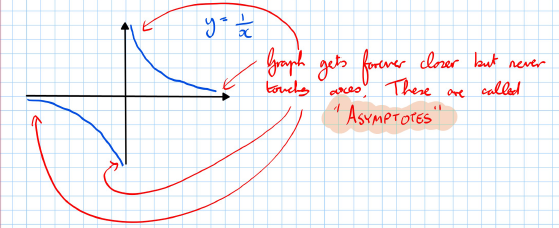
- The graph has two separate curves.
- It gets forever closer but never touches the axes.
- These lines it approaches but never touches are called asymptotes.
5. Graph of
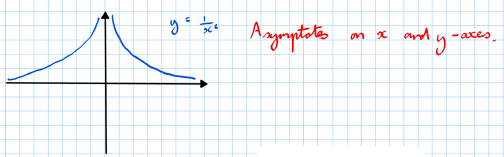
- The graph is symmetrical and has two separate curves.
- It has asymptotes on the x and y-axes.
6. Graph of
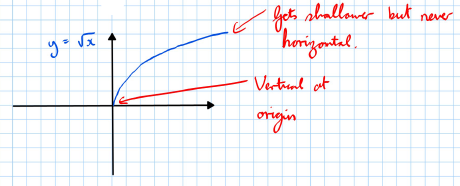
- The graph starts at the origin.
- It gets shallower but never becomes horizontal.
- It is vertical at the origin.