Basic Probability (AQA A-Level Mathematics): Revision Notes
3.1.3 Tree Diagrams
Tree diagrams are a visual representation used in probability to show all possible outcomes of a series of events. Each branch of the tree represents a possible outcome, and the diagram helps in calculating probabilities, especially when dealing with multiple stages or events.
Components of a Tree Diagram
- Branches: Each branch represents a possible outcome of an event. The probability of each outcome is usually written along the branch.
- Nodes: Points where branches split represent different stages or decisions in the process.
- Leaves: The ends of the branches represent the final outcomes of the sequence of events.
Example: Tossing a Coin Twice Let's say you toss a coin twice. The possible outcomes are:
- First Toss: Heads () or Tails ()
- Second Toss: Heads () or Tails () The tree diagram would look like this:
          Start
           /  \
          H    T   (First Toss)
         / \  / \
        H   T H   T (Second Toss)
Calculating Probabilities Using a Tree Diagram
Assume each outcome (Heads or Tails) has a probability of .
- First Event:
- Probability of Heads (H):
- Probability of Tails (T):
- Second Event:
- If the first toss is Heads, the second toss could also be Heads or Tails:
- Probability of Heads after Heads:
- Probability of Tails after Heads:
- Similarly, if the first toss is Tails:
- Probability of Heads after Tails:
- Probability of Tails after Tails: To calculate the probability of getting a specific sequence of outcomes, multiply the probabilities along the branches.
Example:
- Probability of getting Heads followed by Heads (HH):
- Probability of getting Heads followed by Tails (HT):
- Probability of getting Tails followed by Heads (TH):
- Probability of getting Tails followed by Tails (TT):
Applications of Tree Diagrams
- Multiple Stages or Events: Tree diagrams are particularly useful when dealing with sequences of events where the outcome of one event affects the next.
- Conditional Probability: They help in visualising how probabilities change depending on previous outcomes.
- Complex Probability Problems: Tree diagrams break down complex problems into simpler parts, making it easier to calculate overall probabilities.
Example: Drawing Coloured Balls Imagine a bag contains 2 red balls and 1 blue ball.
You draw a ball, record its colour, and then draw another ball without replacing the first.
- First Draw:
- Red (R) or Blue (B)
- Second Draw (if first draw was Red):
- Red (1 remaining) or Blue
- Second Draw (if first draw was Blue):
- Red (2 remaining) The tree diagram would show the probabilities of each sequence of draws, helping you calculate probabilities such as the likelihood of drawing two red balls in a row.
Example:
- Probability of drawing two red balls:
- First Red:
- Second Red:
- Total Probability:
Conditional Probabilities from Tree Diagrams
Steps for Solving Conditional Probability Problems:
- Highlight the "allowed" branches:
- Identify the branches of the tree diagram that are relevant to the condition given (i.e., the "given that" part of the problem).
- Disregard the non-allowed branches:
- Ignore branches that are not relevant to the given condition.
- Calculate the probability of each allowed outcome:
- Determine the probability for each outcome that satisfies the given condition.
- Determine the required probability:
- The final probability is found by dividing the desired outcome's probability by the total probability of all remaining outcomes.
Example Questions
A bag contains five red and four blue tokens. A token is chosen at random, and the colour is recorded. The token is not replaced. A second token is chosen, and the colour is recorded.
Tasks:
-
Draw a tree diagram to illustrate this situation. Find the probability that:
-
The second token is red given that the first token is blue.
-
The first token is red given that the second token is blue.
-
The first token is blue given that the tokens are different colours.
-
The tokens are the same colour given that the second token is red.
Worked Solutions
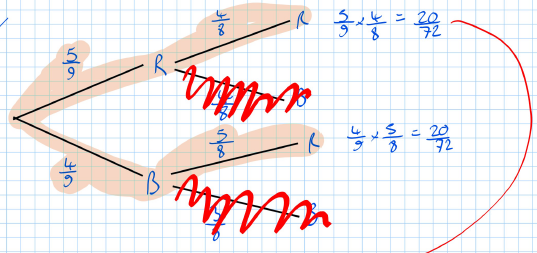
a) Draw a tree diagram to illustrate this situation:
The tree diagram is drawn with the first level representing the first token draw, which can be red () or blue ().
The probabilities are:
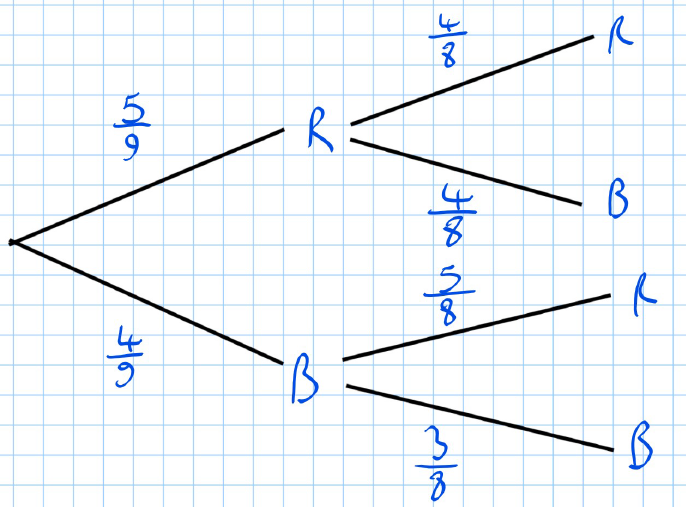
The second level represents the second token draw, contingent on the first draw's result.
If the first token was red:
If the first token was blue:
b) Find the probability that the second token is red given that the first token is blue.
The probability that needs to be calculated can be represented as this:
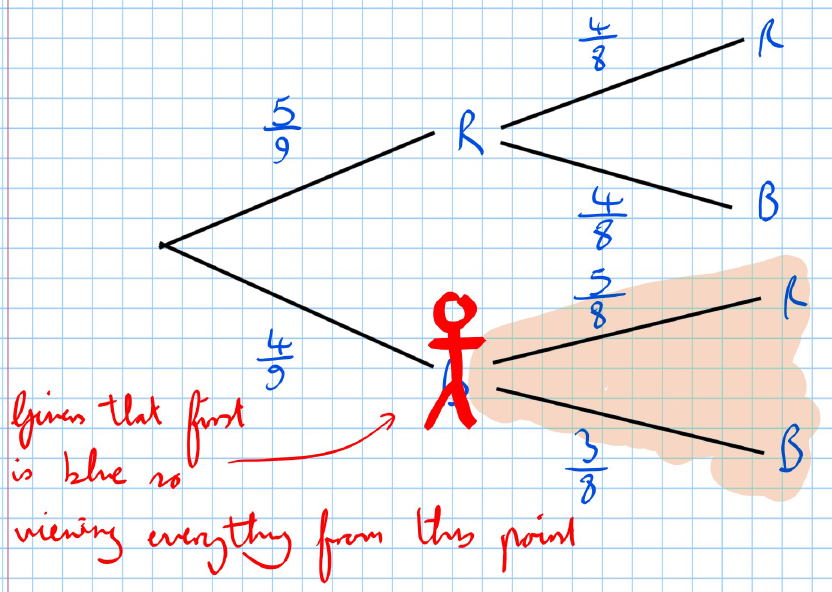
Given that the first token is blue, we ignore the first branch leading to red and focus on the scenario where the first token was blue.
We then calculate the probability of drawing a red token next:
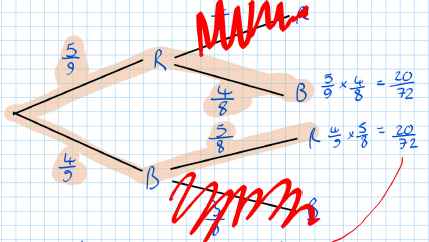
c) Find the probability that the first token is red given that the second token is blue.
The probability that needs to be calculated can be represented as this:
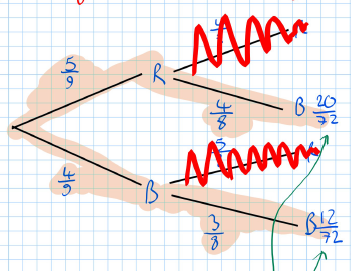
Calculate the probability of the first token being red and the second token being blue:
Calculate the probability of the first token being blue and the second token being blue:
The total probability of the desired outcome is:
Which simplifies to
d) Find the probability that the first token is blue given that the tokens are different colours.
The probability that needs to be calculated can be represented as this:
Calculate the probability of the first token being blue and the second being red:
The total probability for different colours is:
Which is further simplified to
e) Find the probability that the tokens are the same colour given that the second token is red.
The probability that needs to be calculated can be represented as this:
Given that the second token is red:
The probability that the first token was red is calculated as:
The probability that the first token was blue is:
The total probability of the second token being red regardless of the first token is the sum of these probabilities:
To find the probability that the two tokens are the same colour, given that the second token is red, use: