Normal Distribution (A Level only) (AQA A-Level Mathematics): Revision Notes
4.3.3 Standard Normal Distribution
Inverse Normal Distributions
Given a particular probability, the inverse normal distribution function gives us the boundary associated with that probability.
[Note: For the purposes of calculator use, "area" refers to the area to the left of a boundary]
Example:
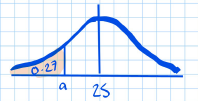
a) Find a guess that
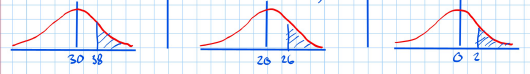
Step 1: If not directly given, work out the area to the left of the unknown boundary and sketch.
- Sketch: A normal distribution curve with mean at .
- The area to the left of point a (denoted by the curve) is .
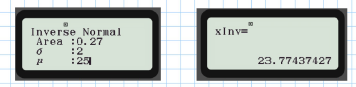
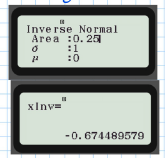
Step 2: Input all of this information into the inverse normal function on the calculator. [Remember: "Area" means area to the left]
- Inverse Normal on Calculator:
- Area:
- :
- :
- =
- So,
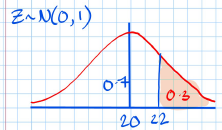
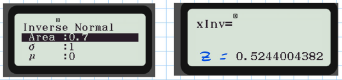
b)
- [Remember: calculator only deals with the area to the left]
- Sketch: A normal distribution curve with mean at . The area to the right of point is , so the area to the left is .
- Inverse Normal on Calculator:
- Area:
- :
- :
-
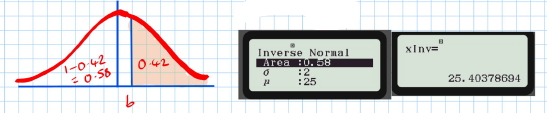
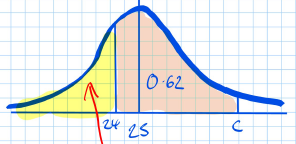
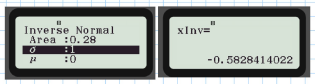
(c)
- [Need to know all areas to the left of the boundary , so must calculate this area to find this.]
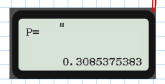
- = (Calculator shows 0.3085375383)
- Therefore,
- [Put this number in inverse function]
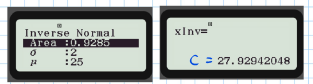
- Inverse Normal on Calculator:
- Area:
- :
- :
-
Example: The masses, grammes, of a brand of chocolate bar are modelled as .
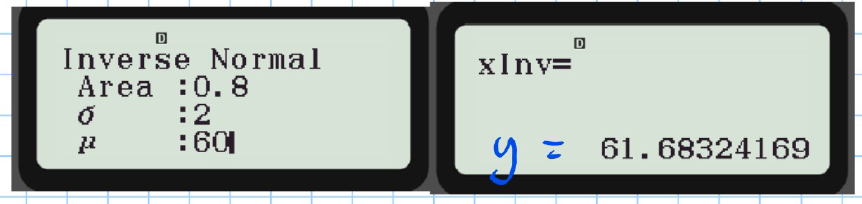
a) Find the value of y such that
Inverse Normal on Calculator:
- Area:
- :
- :
-
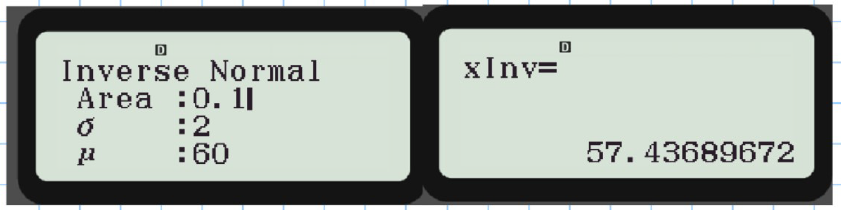
b) Find the % to % interpercentile range of masses.
percentile:
Inverse Normal on Calculator:
- Area:
- :
- :
-
c) Tom says that the median is equal to the mean. State, with a reason, whether Tom is correct.
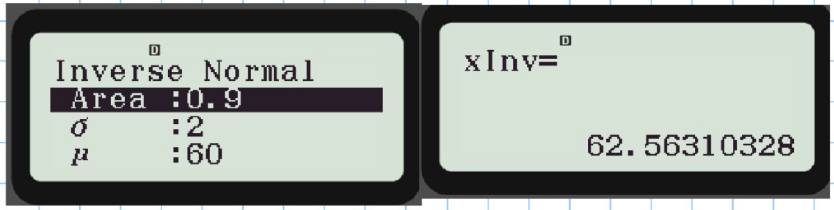
percentile:
Inverse Normal on Calculator:
- Area:
- :
- :
- IPR: 62.563 - 57.637 = 5.126
Tom is correct as the normal distribution is symmetrical about the mean.
Z-Values in the Normal Distribution
Examples:
-
Graphical Representations: All show an area to the right of the value.
-
Probability: All equal Explanation:
-
The reason these answers are all the same is that their boundaries are exactly standard deviations from the mean.
-
The number of standard deviations from the mean in a Normal Distribution is known as the z-value.
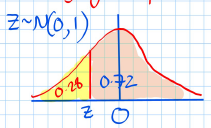
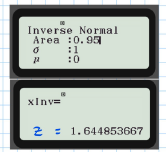
Example: Calculate the z-value for where .
Use this formula:
Substitute in the values and calculate:
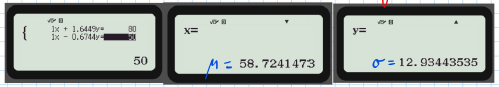
Calculating Unknown Mean or Variance of a Normal Distribution
Example: Find for given that .
Step 1: Calculate z-value for given boundary algebraically:
Step 2: Calculate the corresponding z-value for using given probability
Given:
- Graphical representation shows the area under the curve up to z.
- Using Inverse Normal calculation:
Step 3: Solve the two equations for z simultaneously to find the unknown.
Calculation:
Example: For: , find the standard deviation .
Step 1: Calculate z-value
Step 2: Graphical representation shows the area of to the right of the z-value.
Step 3: Using Inverse Normal calculation
Step 4: Solving for
Q4. (OCR 4733, Jan 2008, Q1)
The random variable T is normally distributed with mean and standard deviation . It is given that and .
Question: Find the values of and .
Given:
For :
The graphical representation shows the area to the right of , which is .
Using the Inverse Normal function:
The equation:
Solves to:
For :
The graphical representation shows the area to the right of , which is
Using the Inverse Normal function:
The equation:
Solves to:
These two equations can be solved using calculator functions to find: