The p-V diagram (AQA A-Level Physics): Revision Notes
📚 Revision Notes
11.2.3 The p-V diagram
infoNote
The p-V diagram represents the relationship between pressure () and volume () in thermodynamic processes. These diagrams are crucial in visualising work done by or on a system as it undergoes various changes in pressure and volume. The area under the curve in a p-V diagram is equivalent to the work done in the process.
Calculating Work from the Area under a p-V Curve
To estimate the work done in a p-V diagram:
- Counting Squares: Count the squares under the curve that are more than half full, and multiply by the area of one square.
- Trapezium Method: Divide the area under the curve into multiple trapeziums, calculate the area of each, and sum them for an accurate result.
Direction of Work Done
- Increase in Volume: Work is done by the system ( is positive).
- Decrease in Volume: Work is done on the system ( is negative).
Types of Thermodynamic Processes on p-V Diagrams
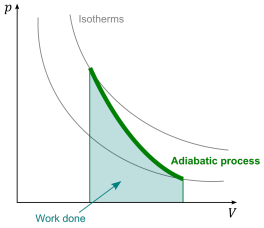
1. Adiabatic Process
- Description: No heat transfer in or out of the system ().
- First Law Application:
- Graph Characteristics: The curve is steep due to rapid changes in internal energy, as all the work done is reflected in changes to internal energy. An adiabatic process does more work than an isothermal process at the same start and end points.
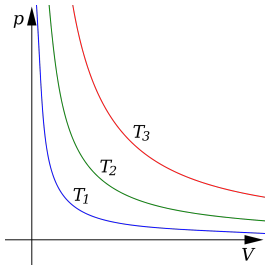
2. Isothermal Process
- Description: Temperature remains constant .
- First Law Application: ,
- Graph Characteristics: The p-V graph (isotherm) shows curves that sit further from the origin at higher temperatures, indicating that pressure decreases as volume increases to maintain constant temperature.
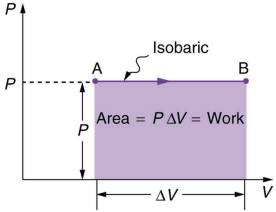
3. Constant Pressure (Isobaric) Process
- Description: Pressure is constant throughout the process.
- Work Done: Calculated by .
- Graph Characteristics: Horizontal line on the diagram, and the area under this line represents the work done.
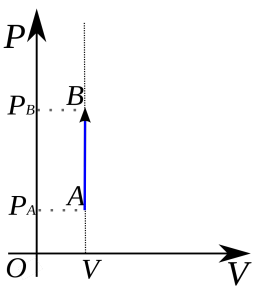
4. Constant Volume (Isochoric) Process
- Description: Volume remains constant, so no work is done ().
- First Law Application: ,
- Graph Characteristics: Vertical line on the diagram, indicating no area under the curve, hence no work is done.
Cyclic Processes on p-V Diagrams
A cyclic process involves a system returning to its original state after undergoing multiple processes. The p-V diagram for a cyclic process forms a closed loop, and the area of the loop represents the net work done per cycle.
- Work Done per Cycle:
- Repeated Cycles: Cyclic processes can repeat indefinitely, releasing energy with each cycle.