Engine cycles (AQA A-Level Physics): Revision Notes
11.2.4 Engine cycles
In thermodynamic cycles, energy is transferred within a system as it undergoes processes that allow it to do useful work. For an engine cycle to be efficient, the energy output (work done by the system) must exceed the energy input (work done on the system).
Internal Combustion Engines
An internal combustion engine is a common example of a thermodynamic system. In this type of engine, cylinders are filled with air and fuel, which are then ignited to produce high-temperature gas that does work on a piston, transferring energy.
Four-Stroke Petrol Engine
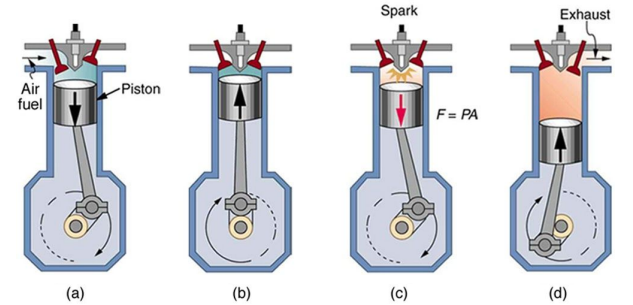
A four-stroke engine goes through four distinct stages, often called the Otto cycle:
- Induction: The piston moves down, increasing the volume inside the cylinder, drawing in a mixture of air and fuel through an open inlet valve. The pressure remains slightly below atmospheric.
- Compression: The inlet valve closes, and the piston moves up, compressing the air-fuel mixture. The volume decreases, pressure increases, and temperature rises. Near the end of this stage, a spark plug ignites the mixture, dramatically increasing pressure and temperature.
- Expansion: The hot gases expand, pushing the piston downwards and doing useful work. This phase is sometimes called the power stroke. Just before the piston reaches the bottom, the exhaust valve opens, releasing pressure.
- Exhaust: The piston moves up, forcing the exhaust gases out through the open exhaust valve, preparing the cylinder for the next cycle.
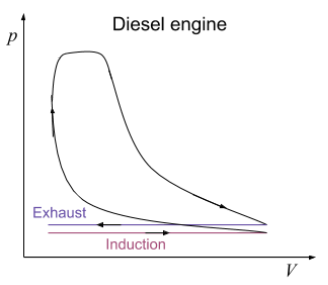
Diesel Engines
In diesel engines, the process is similar, but only air is drawn in during the induction stroke, and diesel fuel is injected into the hot compressed air near the end of the compression phase. This ignites the fuel without a spark plug, due to the high temperature from compression.
Indicator Diagrams
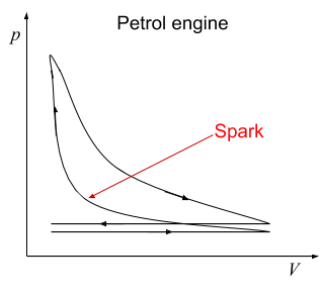
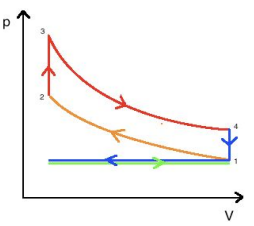
An indicator diagram shows the pressure-volume (p-V) relationship during the cycle, illustrating the work done.
- Theoretical Indicator Diagram assumes:
- Constant gas movement.
- No friction or heat losses.
- Instantaneous temperature and pressure changes.
- Actual Indicator Diagram records real data, showing effects of friction, heat losses, and delay in valve operations.
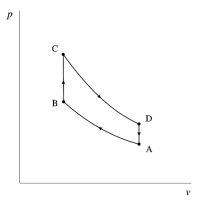
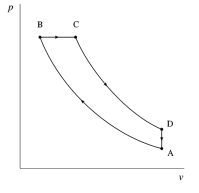
Comparing Diesel and Petrol Engine Cycles
Differences between theoretical and actual diagrams show why real engines are less efficient:
- Rounded edges in actual diagrams indicate delays in valve operation.
- Smaller area in actual diagrams due to energy losses from friction and incomplete fuel combustion.
- Real heating doesn't occur at constant volume, reducing efficiency.
Key Efficiency Terms
- Indicated Power: Power calculated from the area of the main p-V loop.
- Brake Power: Actual power output of the engine, after accounting for friction.
- Friction Power: Power used to overcome frictional forces, calculated as the difference between indicated and brake power.
Efficiency and Power Calculations
- Indicated Power:
- The total work done by the engine per second is known as indicated power.
- Formula:
- Brake Power:
- Brake power is the actual output power after accounting for frictional losses.
- Friction Power represents the difference between indicated power and brake power.
- Efficiency Types:
- Overall Efficiency: Product of thermal and mechanical efficiency.
- Thermal Efficiency: Efficiency of converting fuel energy into work.
- Mechanical Efficiency: Proportion of indicated power that becomes brake power.
- Input Power:
- Calculated as: