Indicators of Growth (Edexcel A-Level Business): Revision Notes
Indicators of growth
Understanding economic indicators
When businesses consider international expansion, investment, or trade opportunities, they need reliable ways to identify where economic growth is likely to occur. Several key indicators help assess an economy's growth potential and development level. The main indicators include GDP per capita, literacy rates, health statistics, and the Human Development Index (HDI).
These indicators serve multiple purposes. They help businesses identify promising markets for exports, locate suitable production facilities, and find regions with skilled workforces. Understanding how to interpret and compare these indicators is essential for making informed strategic decisions in global business.
Multiple Perspectives for Strategic Planning
These economic indicators don't work in isolation—they work best when used together. A country with high GDP but low literacy might present different opportunities than one with moderate GDP but excellent education systems. Smart businesses analyze multiple indicators to build a complete picture of market potential.
Gross Domestic Product (GDP) per capita
What GDP per capita measures
GDP per capita measures the total value of all goods and services produced in a country during one year, divided by the population. This gives an average economic output per person, making it easier to compare economies of different sizes.
While the absolute value of GDP per capita is important, businesses typically focus more on the trend or direction of change. For example, China's GDP growth rate was 7.4% in 2014, which sounds impressive. However, this actually represented a slowdown from the 7.7% growth recorded in 2013. This declining trend might concern investors even though growth remains high.
Worked Example: Interpreting GDP Growth Trends
Consider two countries with the following GDP growth rates:
Country A:
- 2012: 8.5%
- 2013: 8.2%
- 2014: 7.9%
Country B:
- 2012: 3.1%
- 2013: 3.5%
- 2014: 4.2%
Although Country A has higher absolute growth rates, Country B shows an upward trend that may signal strengthening economic conditions. Country A's declining trend could indicate economic challenges ahead, despite maintaining relatively high growth. Investors would need to investigate the reasons behind these trends before making decisions.
Real GDP versus nominal GDP
When interpreting GDP figures, it's crucial to understand whether you're looking at real GDP or nominal GDP:
- Real GDP adjusts figures for inflation, showing the true increase in economic output
- Nominal GDP does not account for inflation, so it can be misleading when prices are rising rapidly
Why Real GDP Matters More
Real GDP provides a more accurate picture of economic growth because it shows actual increases in production rather than just price increases. For example, if nominal GDP grows by 5% but inflation is 3%, real GDP growth is only 2%. Always prioritize real GDP figures when making business decisions about economic growth.
Finding and evaluating GDP data
GDP data comes from various sources. In the UK, the Office for National Statistics (ONS) compiles figures using rigorous methods and error-checking procedures. For other countries, data comes from international organizations like the World Bank or International Monetary Fund (IMF).
However, data quality varies significantly between countries. The reliability depends on the source and collection methods used. When comparing GDP data, you should:
- Always cite your sources
- Be cautious when using data from different organizations
- Recognize that data may not always be consistent, comparable, or easy to verify
- Use figures over a period of time rather than single data points
Data Quality Considerations
Different organizations may report slightly different GDP figures for the same country due to varying collection methods, timing, and adjustments. This doesn't necessarily mean one source is wrong—it reflects the complexity of measuring an entire economy. When possible, cross-reference multiple sources and look for consistent patterns rather than precise numbers.
Challenges in comparing GDP across countries
Several factors make international GDP comparisons difficult:
Currency differences: GDP figures are reported in different currencies, making direct comparisons problematic. Most GDP statistics use market exchange rates derived from foreign exchange markets. However, these rates fluctuate constantly, causing GDP figures to change rapidly even when actual economic activity remains stable.
Cost of living differences: Goods and services cost more in high-income countries. A GDP figure of $50,000 per capita in Switzerland doesn't buy the same amount as $50,000 in Thailand. This means GDP figures based on market exchange rates may overstate what people in wealthy countries can actually purchase.
Purchasing Power Parity (PPP)
To address these comparison problems, economists prefer using Purchasing Power Parity (PPP) exchange rates. PPP measures how much it costs to buy a standardized basket of goods and services in different countries.
The PPP exchange rate shows how much of one country's currency you need to buy the same basket of goods and services in another country. This approach gives investors a better understanding of what consumers in different countries can actually afford, making it more useful for business decisions.
The PPP Advantage for Business Decisions
The difference between market exchange rates and PPP can be substantial, especially for developing countries. PPP figures provide more realistic assessments of consumer purchasing power than market exchange rate figures, making them essential for evaluating potential markets.
Consider these examples from 2014:
United Kingdom:
- Market exchange rate GDP: $2.9 trillion
- PPP-adjusted GDP: $2.4 trillion
- Difference: PPP figure is lower because high UK prices mean less purchasing power
India:
- Market exchange rate GDP: $2.0 trillion
- PPP-adjusted GDP: $7.0 trillion
- Difference: PPP figure is much higher because lower Indian prices mean greater purchasing power
Worked Example: Understanding PPP Impact
Imagine a Big Mac costs $5 in the United States and ₹150 in India. At a market exchange rate of ₹60 per dollar, the Indian Big Mac costs $2.50 in dollar terms.
Using market exchange rates: Indian prices appear 50% lower Using PPP: The exchange rate would adjust to reflect this price difference (₹30 per dollar)
For a business evaluating the Indian market, PPP reveals that consumers have greater purchasing power than market exchange rates suggest. A product priced at $100 in the US might need to be priced at ₹3,000 in India (using PPP) rather than ₹6,000 (using market rates) to match local purchasing power.
For businesses evaluating potential markets, PPP figures provide more realistic assessments of consumer purchasing power than market exchange rate figures.
Literacy rates
Why literacy matters for business
Workforce quality is just as important as workforce size. A company investing in a country needs to hire productive employees at competitive costs. Similarly, a firm exporting to a country must understand its potential customers and how to market effectively to them.
Literacy rate measures the percentage of adults (people over 15 years old) who can read and write. This indicator is crucial because:
- Literate workers can follow written instructions, use technology, and adapt to new processes more easily
- Literate consumers can read product information, advertisements, and instructions
- Higher literacy rates generally correlate with higher productivity and economic development
- Literacy affects a country's ability to adopt new technologies and innovations
The United Nations provides literacy data for most countries, allowing businesses to make informed comparisons.
International literacy comparisons
Literacy rates vary dramatically across countries, reflecting different levels of development and educational investment:
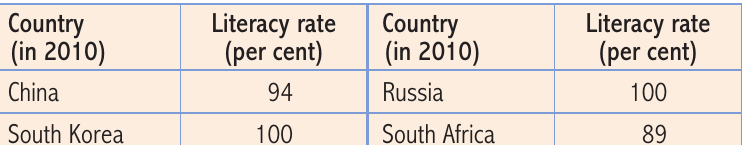
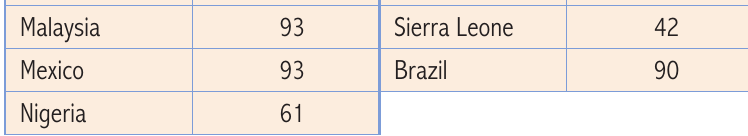
These figures reveal significant patterns. Developed economies like South Korea and Russia achieve near-universal literacy (100%), while many developing nations struggle with lower rates. Sierra Leone's 42% literacy rate indicates that more than half the adult population cannot read or write, which has profound implications for business operations and market potential.
Business Implications of Literacy Variations
For businesses, literacy statistics inform several critical decisions:
- Recruitment strategies: Countries with higher literacy rates offer larger pools of educated workers
- Market potential: Literate populations can engage with sophisticated marketing and complex products
- Training requirements: Lower literacy rates mean companies must invest more in visual training materials and hands-on instruction
- Product adaptation: Products may need simplified instructions or visual guides in low-literacy markets
Health indicators
The importance of health statistics
A population's health status provides another critical indicator of development and economic potential. Healthy workers are more productive, take fewer sick days, and can work effectively for longer periods. Health indicators help businesses assess:
- Workforce reliability and productivity
- Healthcare costs and benefits expenses
- Long-term demographic trends
- Quality of life and consumer spending patterns
Key health measures
Health assessments typically include several factors:
- Life expectancy at birth: How long people typically live
- Infant and maternal mortality: Death rates for babies and mothers during childbirth
- Pollution exposure: Environmental health risks
- Access to clean water: Basic sanitation and health infrastructure
WHO's Comprehensive Health Database
The World Health Organization (WHO) collects and evaluates comprehensive health statistics, including:
- Life expectancy and mortality rates: Overall death rates and age-specific mortality
- Causes of death: Including both communicable diseases (infectious) and non-communicable diseases (like cancer or heart disease)
- Infectious diseases: Prevalence of conditions like malaria, tuberculosis, or HIV
- Risk factors: Sanitation quality, clean water access, and breastfeeding rates
- Health infrastructure: Availability of hospitals, clinics, and essential medicines
- Other factors: Total health spending, immunization coverage, contraception access, and socio-economic conditions
Life expectancy and infant mortality trends
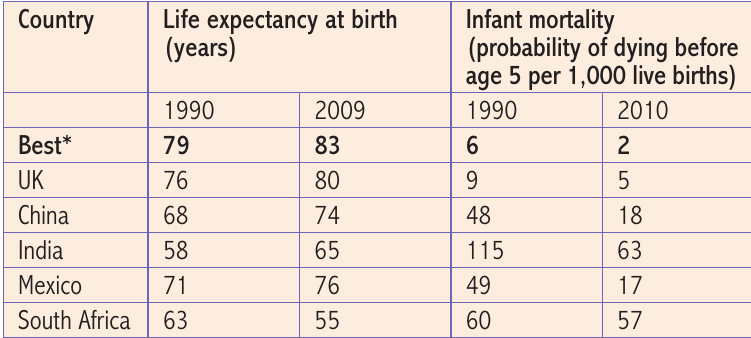
This data reveals several important trends:
Progress in most countries: Between 1990 and 2009, most countries showed significant improvements in life expectancy. China's life expectancy increased from 68 to 74 years, while India improved from 58 to 65 years. These gains reflect better healthcare, improved nutrition, and economic development.
Declining infant mortality: All countries except South Africa showed dramatic reductions in infant mortality between 1990 and 2010. China reduced infant deaths from 48 per 1,000 live births to 18 per 1,000—a remarkable achievement that indicates better maternal care, improved sanitation, and access to medical facilities.
Concerning exceptions: South Africa's declining life expectancy (from 63 to 55 years) reflects the devastating impact of the HIV/AIDS epidemic and suggests serious public health challenges that would concern potential investors.
Health Statistics as Economic Indicators
For businesses, these health statistics matter because:
- Longer life expectancy creates markets for retirement products, healthcare services, and leisure activities
- Lower infant mortality suggests improving living standards and potentially growing future markets
- Health improvements indicate economic development and rising consumer purchasing power
- Poor health outcomes may signal infrastructure problems or social instability
Human Development Index (HDI)
Understanding the HDI
The Human Development Index (HDI) provides a comprehensive measure of development by combining three key dimensions into a single, rankable value. Published by the United Nations Development Programme, the HDI focuses on people and their capabilities rather than purely economic measures.
The three components of HDI are:
- Life expectancy: Health and longevity
- Education: Knowledge and skills
- Income: Standard of living
By combining these elements, the HDI recognizes that development involves more than just economic growth. A country might have high GDP but poor health outcomes or limited education—the HDI captures this complexity.
Beyond Pure Economic Measures
The HDI's strength lies in its holistic approach. While GDP tells us about economic activity, it doesn't reveal whether that wealth translates into better health, education opportunities, or improved living standards. The HDI fills this gap by measuring what ultimately matters: human wellbeing and capability.
Life expectancy component
Life expectancy measures how many years a person can expect to live on average. This indicator reflects:
- Healthcare system quality and accessibility
- Public health infrastructure
- Nutrition and food security
- Social safety nets and welfare systems
Countries with the longest life expectancy in 2014 included:
- Japan: 83.6 years
- Hong Kong: 83.4 years
- Switzerland: 82.4 years
- Italy: 82.4 years
At the opposite extreme:
- Sierra Leone: 45.6 years (lowest)
- Swaziland: 49 years
- Lesotho: 49.4 years
These dramatic differences reflect not just healthcare quality but broader development challenges including poverty, conflict, and disease.
Education component: mean years of schooling
Mean years of schooling estimates the average amount of education a 25-year-old person has received. This measure provides insight into workforce skills and educational investment, though it doesn't capture educational quality.
Leading countries for educational attainment in 2014 included:
- United States and Germany: 12.9 years
- Australia: 12.8 years
- New Zealand and Israel: 12.5 years
- Lithuania: 12.4 years
Countries with the lowest educational attainment:
- Burkina Faso: 1.3 years
- Niger: 1.4 years
- Chad: 1.5 years
The Educational Divide
These figures reveal the educational divide between developed and developing nations. Countries with higher educational attainment typically offer:
- More skilled workforces for businesses to recruit
- Greater capacity for innovation and technological adoption
- Higher productivity and economic growth potential
- More sophisticated consumer markets
Income component: Gross National Income per capita
Gross National Income (GNI) per capita illustrates the relative wealth of a population, measured using PPP to enable accurate international comparisons.
Wealthiest populations in 2014 (GNI per capita in PPP$):
- Qatar: $119,029
- Liechtenstein: $87,000
- Kuwait: $85,820
- Singapore: $72,300
Poorest populations:
- Democratic Republic of the Congo: $444
- Central African Republic: $588
- Malawi: $715
- Burundi: $749
These stark contrasts highlight the enormous disparities in living standards globally. High GNI per capita suggests:
- Strong consumer purchasing power
- Potential markets for premium products
- Better infrastructure and business environment
- Political stability and economic development
How businesses use the HDI
The HDI helps businesses make strategic decisions about expansion, investment, and operations. Consider these applications:
Worked Example: Market Assessment for Elderly Products
A company selling products for elderly consumers would examine life expectancy data to identify countries with aging populations. They would then cross-reference this with GNI per capita data to find markets where elderly people can afford their products.
Step 1: Identify countries with high life expectancy (80+ years)
- Japan, Switzerland, Italy, Australia
Step 2: Check GNI per capita to ensure purchasing power
- Japan: $36,747 ✓
- Switzerland: $56,431 ✓
- Italy: $33,030 ✓
- Australia: $42,261 ✓
Step 3: Prioritize markets All four countries show strong potential with both aging populations and sufficient purchasing power. This targeted approach helps businesses focus resources on the most promising opportunities.
Recruitment planning: A technology company seeking scientists and engineers would use the mean years of schooling data to identify countries with highly educated populations. They could then target recruitment efforts in these locations, knowing they're more likely to find qualified candidates.
Investment decisions: When considering where to establish manufacturing facilities, businesses would analyze all three HDI components. High life expectancy suggests a stable society, good education indicates a skilled workforce, and adequate income levels mean local employees can support themselves and contribute to the economy.
Comprehensive Development Picture
By synthesizing health, education, and income data, the HDI provides a more complete picture of a country's development than GDP alone. This comprehensive view helps businesses make better-informed decisions about where to invest, operate, and sell their products.
Remember!
Key Points to Remember:
- GDP per capita measures economic output per person, but focus on trends rather than single figures
- Use PPP (Purchasing Power Parity) rather than market exchange rates when comparing countries—it shows what people can actually afford
- Literacy rates matter for both workforce quality (can workers read instructions?) and market potential (can consumers understand your product?)
- Health indicators like life expectancy and infant mortality reveal development levels and indicate improving living standards
- The Human Development Index (HDI) combines life expectancy, education, and income to provide a comprehensive development measure that's more useful than GDP alone for business decisions
- Always verify data sources and recognize that data quality varies between countries—use multiple indicators together for more reliable assessments